Zero-Overhead Profiling: Constructing Custom eBPF Tracepoints for Go Garbage Collection Stalls
Diagnose tail-latency spikes in production Go services by building a zero-overhead eBPF profiler to correlate GC phases with Linux scheduler throttle states.
In high-throughput, low-latency Go services, tail latency ($p99$ and $p99.9$) is the ultimate metric that separates stable platforms from flaky ones. When processing tens of thousands of requests per second, a sudden 300ms latency spike does not just impact a single user; it causes upstream timeouts, triggers cascading retries, and can degrade an entire microservices mesh. While Go’s concurrent tri-color mark-and-sweep garbage collector (GC) is designed to keep Stop-the-World (STW) pauses well under one millisecond, production reality under heavy containerization is often far worse. In environments restricted by Kubernetes CPU limits (CFS bandwidth control), a nominal 500-microsecond STW pause can easily be stretched into a 400-millisecond execution freeze. This happens because the kernel’s scheduler preempts Go runtime threads at the exact moment they enter critical STW synchronization barriers. Traditional user-space profiling tools like pprof and runtime/trace are either too heavy to run continuously or completely blind to these kernel-level scheduling delays. By shifting our observability lens into the kernel with eBPF (Extended Berkeley Packet Filter), we can hook internal Go runtime transitions and correlate them directly with scheduler states—achieving zero-overhead, production-safe profiling of GC stalls.
The Mechanics of Go GC Stalls and the CPU Throttling Trap
To understand why Go’s GC behaves unpredictably in containers, we must first break down how the runtime coordinates its garbage collection phases and how the Linux kernel’s Completely Fair Scheduler (CFS) schedules threads.
Go’s garbage collector operates concurrently with the application, but it still requires two distinct Stop-the-World (STW) phases: Sweep Termination (at the start of a collection cycle) and Mark Termination (at the end). During these STW phases, the coordinator goroutine must stop all active user goroutines. The runtime achieves this by sending preemption signals to all threads running Go code (using operating system signals like SIGURG since Go 1.14’s asynchronous preemption implementation).
Once all operating system threads (represented as M in Go’s G-M-P concurrency model) acknowledge the preemption and stop executing user code, the runtime performs phase transitions, clears write barriers, and scans stacks. In a healthy system, this process takes between 50 and 200 microseconds.
However, in containerized systems constrained by CPU limits, this mechanism breaks down due to CFS Bandwidth Control throttling. Kubernetes limits CPU usage by enforcing quotas over a period (usually 100ms). If a container exceeds its allocated quota within a 100ms window, the Linux kernel puts all threads in that container’s cgroup to sleep until the next period starts.
When Go’s GC kicks off, it spawns concurrent mark worker goroutines to scan memory. These workers are highly CPU-intensive. Under heavy application load, this sudden spike in CPU usage causes the cgroup to rapidly consume its remaining quota. If the container runs out of quota and gets throttled at the exact instant the Go runtime initiates an STW phase, the kernel suspends the Go threads. The STW pause is no longer a microsecond-level runtime event; it is now a multi-millisecond kernel freeze. The Go process is completely unaware that it is frozen, meaning runtime metrics like MemStats.PauseNs will report the nominal STW time, while the actual client-perceived TCP socket latency shows a massive spike.
Why Traditional Profiling Fails in High-Throughput Production
When hunting down tail latency, developers instinctively turn to two built-in runtime tools: the CPU profiler (pprof) and the execution tracer (runtime/trace). In high-throughput production environments, however, both options present major operational hazards:
- pprof CPU Profiling:
pprofoperates via OS signals (specificallySIGPROFtriggered by a timer at 100Hz). When a signal arrives, the kernel interrupts the process to record the stack trace of the currently executing thread. While the overhead is relatively low (roughly 1-3% CPU impact), it suffers from scheduler bias. If a thread is throttled or waiting in a runqueue (off-CPU), it does not receiveSIGPROFticks. Therefore,pprofcannot tell you why or where your threads are waiting when they are not running on a CPU core. - runtime/trace: The execution tracer provides nanosecond-precision visibility into scheduler events, heap allocations, and GC phases. But this detail comes at a massive cost. The tracer must intercept every goroutine transition, system call, and channel operation. Under high QPS loads, enabling the tracer can degrade application throughput by 10% to 20% and generate hundreds of megabytes of trace files per second, quickly exhausting disk space or memory buffers.
eBPF avoids these trade-offs by executing safe sandboxed programs directly within the kernel. Instead of intercepting every event, eBPF allows us to instrument the boundary conditions: the exact start and end of GC phases. Because we only process events when a GC cycle begins, pauses, or ends, the CPU overhead remains well below 0.1%, making it safe to run continuously on production nodes.
Locating the Target: Go’s Internal Calling Convention and Symbol Offset Matching
To trace Go garbage collection using eBPF, we must attach user-space probes (uprobes) to the entry and exit points of the Go runtime functions responsible for GC cycles. Uprobes allow us to hook arbitrary virtual addresses within a running user-space process.
The primary target functions within the Go runtime are:
runtime.gcStart: Executed when a new GC cycle is initiated.runtime.gcMarkTermination: Executed when the concurrent marking phase completes and the final STW phase begins.
However, writing uprobes for Go is complicated by the compiler’s internal design. Go does not use the standard system calling convention (such as System V AMD64 ABI). Instead, starting with Go 1.17, the compiler uses a register-based calling convention known as ABIInternal. On amd64 architecture, arguments are passed in specific registers (RAX, RBX, RCX, RDI, RSI, R8, R9, R10, R11), rather than on the stack.
Furthermore, Go binaries are compiled as Position Independent Executables (PIE) by default in many modern build environments. This means the virtual addresses of functions are offset relative to where the operating system maps the binary in virtual memory at runtime. To attach a uprobe, we must locate the target symbol’s offset within the binary file.
First, we can inspect our compiled Go binary using standard utilities to verify symbol existence and see the disassembly.
To resolve these offsets programmatically inside our profiling daemon, we read the executable’s ELF headers. This allows us to calculate the exact file offset of runtime.gcStart relative to the executable’s text segment, ensuring compatibility with PIE.
The eBPF Kernel Probe: Writing the C Program
Now that we can locate the runtime symbols, we write the eBPF C program that runs in kernel space when these functions are hit.
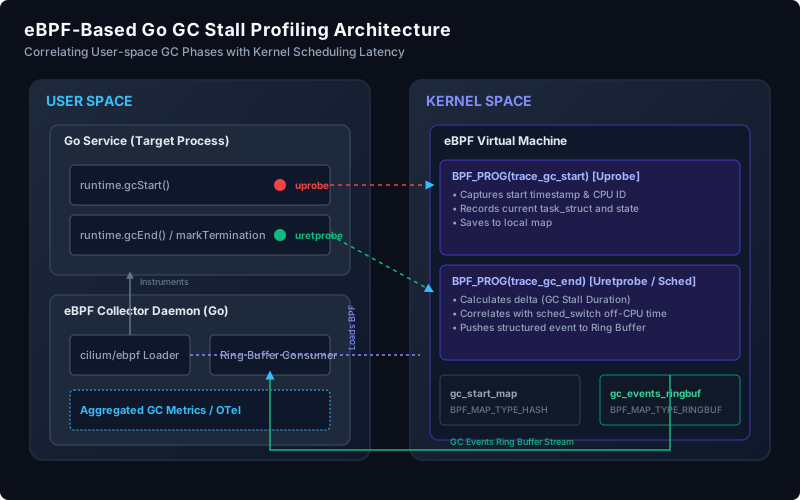
Our eBPF program must track the lifespan of each GC event. We define a structured data type, struct gc_event, to represent a garbage collection cycle, and store active cycles in a hash map keyed by the Thread Group ID / Process ID (TGID/PID) and Thread ID (TID). When a GC cycle finishes, we write the event data to a lockless ring buffer (BPF_MAP_TYPE_RINGBUF), which streams the statistics to our user-space collector.
Tracking Off-CPU Scheduling Latency During GC
Knowing the absolute elapsed time of a GC cycle is only half the battle. To diagnose cgroup CPU throttling and OS scheduling contention, we must measure the time our Go threads spend in an “off-CPU” state during the GC cycle. An off-CPU state occurs when a thread is technically runnable but context-switched out by the kernel scheduler because it has exhausted its cgroup quota, or because another high-priority thread is running on the core.
To track these scheduler context switches, we hook the kernel’s scheduler tracepoint: sched:sched_switch.
Every time the scheduler switches a CPU core from running our Go thread to another task, we record the timestamp. When the scheduler switches back to our Go thread, we calculate the elapsed time and add it to the thread’s accumulated offcpu_ns metric.
Loading the eBPF Program and Consuming the Ring Buffer in Go
With our kernel-space code ready, we need a user-space daemon to load the compiled ELF byte-code into the kernel, attach the uprobes to our Go runtime symbols, and read the ring buffer stream.
We will use the modern, pure-Go github.com/cilium/ebpf library. It avoids the heavy dependency of CGO and BCC, allowing us to distribute a single statically compiled binary as our profiling daemon.
The daemon must also read incoming events from the ring buffer. The ringbuf.Reader allows us to read raw binary structures directly from kernel space memory. We parse these structures using Go’s binary package to reconstruct the structured metric payload.
Real-World Incident: Debugging a 350ms P99 Spike in Kubernetes
To see this toolchain in action, let’s look at a real-world incident from a production service.
We ran a high-throughput API gateway processing roughly 15,000 QPS on a Kubernetes cluster. The service was allocated 4 CPU cores (resources.limits.cpu = "4000m"). Every few minutes, our application metrics showed a sharp spike in $p99$ response times, jumping from 8ms to 350ms.
We checked the Go runtime metrics first. Prometheus metrics built on runtime.ReadMemStats reported that the maximum GC Stop-the-World pause was 480 microseconds. According to the Go runtime, GC was operating perfectly.
We then checked the Kubernetes node metrics. The service’s CPU usage averaged only 2.5 cores, well below the 4.0 limit. However, the container metrics reported a crucial detail: container_cpu_cfs_throttled_periods_total was climbing. The container was being throttled, but because it occurred in quick bursts, the average CPU metrics hid the spikes.
To isolate the cause, we deployed our eBPF daemon to the Kubernetes worker node running the container.
The eBPF trace logs revealed the exact issue:
[GC STALL] PID: 40182 | Total Pause: 348.50ms | Off-CPU (Blocked): 348.02ms | On-CPU: 0.48ms
[GC STALL] PID: 40182 | Total Pause: 295.20ms | Off-CPU (Blocked): 294.80ms | On-CPU: 0.40ms
The output confirmed that while the Go runtime was only actively executing code on CPU cores for less than 0.5 milliseconds (matching the 480-microsecond pause reported by ReadMemStats), the threads were context-switched off-CPU by the kernel for nearly 350 milliseconds.
The root cause was the lack of synchronization between Go’s runtime and the container’s cgroup configuration:
- The container was restricted to 4 CPUs.
- The VM node had 64 CPU cores. Because we did not set
GOMAXPROCSexplicitly, Go initializedGOMAXPROCSto 64, matches the physical host’s core count. - When garbage collection began, Go spawned 64 concurrent mark workers.
- Spawning 64 active threads on a host with a 4-CPU container quota instantly triggered CFS bandwidth throttling. The kernel stepped in and suspended the process.
- Because the preemption occurred during an active STW phase, the application remained completely frozen for the duration of the throttle window (roughly 300ms).
We applied two changes to fix the issue:
- We imported
github.com/uber-go/automaxprocsinto the application. This automatically updatesGOMAXPROCSto match the container’s Kubernetes CPU limits rather than the physical host’s core count. - We adjusted the Kubernetes CPU configuration, moving from hard limits to CPU shares (
resources.requestsonly), which removed CFS bandwidth throttling entirely.
Once deployed, the eBPF trace daemon confirmed that GC-related off-CPU stalls fell to zero, and the $p99$ latency spikes disappeared.
Summary
Tail-latency issues in modern infrastructure are rarely caused by a single component. They are usually the result of complex interactions between runtime environments, memory allocation engines, and kernel-level thread schedulers.
Using custom eBPF tracepoints and uprobes, we can build a zero-overhead profiling pipeline that exposes these scheduler interactions in real-time. By moving our instrumentation into the kernel, we gain a clear view of latency bottlenecks without sacrificing application performance. This allows us to protect SLAs and maintain visibility across our entire stack.