Tracing PostgreSQL Locks and Wait Events in Production using eBPF and OpenTelemetry
Learn how to build a zero-overhead database tracing pipeline by intercepting PostgreSQL semaphore calls in the Linux kernel and emitting OTel spans.
Your application is grinding to a halt: API latency is spiking to 5 seconds, connections in your Go or Python service pool are fully exhausted, and system health alerts are screaming. Yet, looking at your PostgreSQL monitoring dashboard, CPU utilization is sitting at a cool 12%, disk I/O is nominal, and memory pressure is nonexistent. This is the classic, agonizing database lock lockup—where backend processes are silently sleeping, waiting for locks or internal database resources (wait events) to release. Traditionally, diagnosing this in real-time meant running aggressive poll scripts against pg_stat_activity and pg_locks every second, introducing significant CPU overhead and missing transient, sub-second locks that stack up over time. By leveraging eBPF (Extended Berkeley Packet Filter) to intercept System V semaphore syscalls at the Linux kernel level and shipping the correlated telemetry through OpenTelemetry, we can achieve low-overhead, millisecond-accurate tracking of PostgreSQL lock wait events directly stitched into our distributed traces.
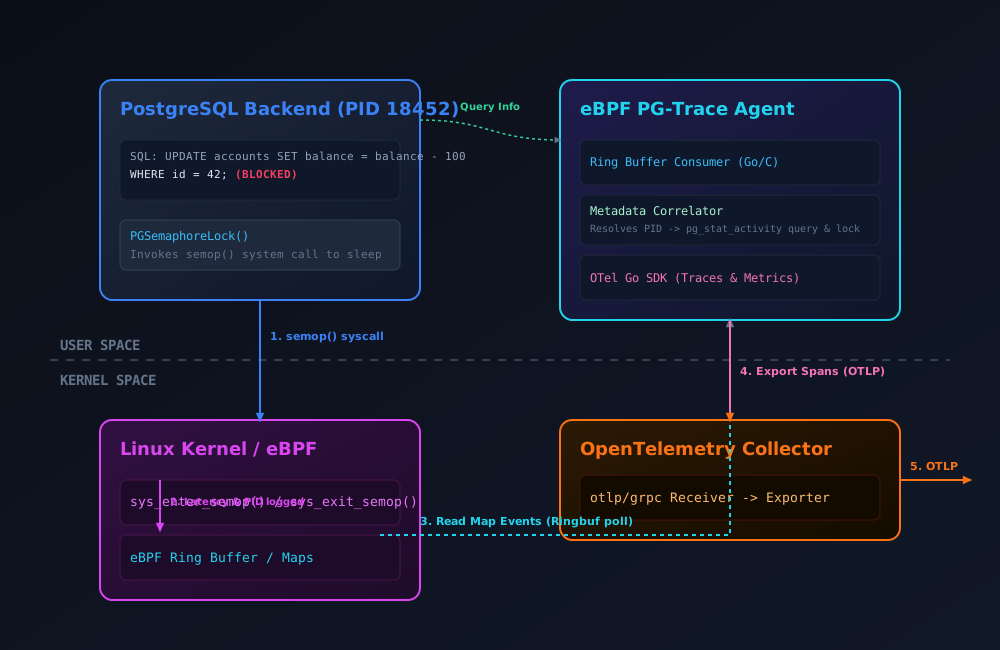
PostgreSQL Locking Under the Hood: Semaphores and Sleeping Backends
To design a tracing system, we must first understand how PostgreSQL implements blocking. PostgreSQL is designed around a multi-process architecture where each client connection is handled by a dedicated backend OS process. Coordinating access to shared memory buffers, data blocks, and transaction states requires a tiered locking hierarchy.
First, there are heavyweight locks, managed by the database Lock Manager. These coordinate table-level and row-level access (such as AccessExclusiveLock for migrations or RowExclusiveLock for inserts/updates). If a transaction requests an incompatible lock on a relation, it must wait. Second, there are lightweight locks (LWLocks), which protect shared memory data structures. Examples include the ProcArrayLock (which tracks all active transactions) and buffer content locks. Third, there are spinlocks, used for brief CPU exclusions lasting only a few instructions.
When a PostgreSQL backend process needs to acquire an LWLock or heavyweight lock and cannot do so immediately, it does not loop on spinlocks, which would waste CPU cycles. Instead, it prepares to sleep. The PostgreSQL core uses semaphores for process synchronization. On Linux, PostgreSQL allocates a set of System V semaphores upon startup. Each backend process is assigned a specific semaphore in this set (referred to as its process semaphore).
When a process must wait for a lock to clear, it invokes the internal function PGSemaphoreLock() (found in src/backend/port/sysv_semaphore.c). Under the hood, this translates to a semop(2) or semtimedop(2) system call, passing the backend process’s semaphore ID and decrementing it. The Linux kernel’s scheduler intercepts this call, changes the process state from TASK_RUNNING to TASK_INTERRUPTIBLE, and removes it from the run queue. When the transaction holding the lock commits, it calls PGSemaphoreUnlock(), which issues another semop system call to increment the semaphore, waking up the waiting backend process.
Consequently, the time spent inside the semop syscall is the exact duration the PostgreSQL backend spent blocked on a wait event. By measuring the entry and exit times of this system call in the kernel, we can measure database blocking latency with nanosecond accuracy, bypassing the database layer entirely.
The eBPF Advantage: Continuous Zero-Overhead Interception
Historically, monitoring these wait events meant running periodic queries against the pg_stat_activity and pg_locks views. For example, a polling script might query the database every second:
SELECT pid, wait_event_type, wait_event, query FROM pg_stat_activity WHERE wait_event IS NOT NULL;
In production environments, this approach fails for three reasons:
- Sampling Bias (Nyquist Limit): A lock wait lasting 150ms starting and ending between sample queries will not be captured, even if it happens thousands of times, serializing execution and creating a bottleneck.
- Catalog Lock Contention: Querying
pg_locksrequires acquiring locks on the database catalog. During a severe locking incident (a “lock storm”), running catalog queries can worsen the contention, leading to database lockups. - Trace Disconnection: Polling only provides a snapshot of the database state. It cannot link a specific lock wait back to the HTTP request trace that initiated the transaction.
By using eBPF, we move the collection boundary from userspace database queries into kernel space. eBPF allows us to load sandboxed programs that execute directly within the kernel on specific system events. We can hook the entry and exit points of the semop and semtimedop system calls using kernel tracepoints.
When a Postgres process enters semop, we store a timestamp in an eBPF hash map, using the thread PID as the key. When the process exits semop, we look up the timestamp, calculate the duration, and delete the map entry. If the duration exceeds a defined threshold (e.g., 10 milliseconds), we write an event to an eBPF ring buffer. If the sleep is shorter than the threshold, we discard it, saving memory and processing time.
The following C program shows how to implement this kernel-level tracing:
This code leverages BPF_MAP_TYPE_RINGBUF, a lockless, memory-mapped queue that replaced perf buffers in modern Linux kernels. The ring buffer minimizes memory copies between kernel and user space and provides better throughput under high concurrency.
Bridging Kernel Space and Postgres: The Userspace Collector
The eBPF kernel program identifies when a process blocked and for how long, but it lacks database context. It does not know the SQL query being executed, the name of the lock, or which query blocked it.
To bridge this gap, we run a userspace daemon (written in Go) on the database host. The daemon loads the eBPF program, hooks the tracepoints, and reads from the ring buffer. When a slow lock event is received, the daemon queries PostgreSQL to resolve the metadata for the reported PID.
Because this metadata lookup is triggered asynchronously, out-of-band, and only for queries that have already blocked past our threshold, the database overhead remains low. If your database executes 50,000 queries per second and only 2 block for longer than 10ms, the agent only makes 2 metadata lookups per second.
The Go daemon loop is structured as follows:
High-Performance Lock Resolution Queries
To fetch the database metadata for a blocked PID, we execute an optimized SQL query. Under high load, querying pg_locks globally can be slow. Therefore, we use a query targeted directly to our blocked PID.
The query finds the ungranted lock held by the blocked PID, matches it against granted locks on the same database resource (such as a table, page, or tuple), and pulls the active SQL queries and wait events for both processes from pg_stat_activity.
This query uses IS NOT DISTINCT FROM checks for nullable fields (like relations or tuples) to ensure we match lock types accurately. By filtering early on blocked.pid, PostgreSQL uses nested index loops to query the catalog, completing the search in less than a millisecond.
Distributed Tracing Stitching via SQLCommenter
Knowing the SQL queries and lock durations is useful, but the key to end-to-end observability is linking this data to your distributed traces. If an API call fails with a 504 Gateway Timeout, you should be able to see the specific database lock wait that caused it directly in your distributed trace view.
To achieve this, the application server must pass its trace context down to PostgreSQL. We use SQL Comment Injection, popularized by libraries like Google’s SQLCommenter. When the application server executes a query, it appends a structured comment containing the W3C traceparent context header:
UPDATE accounts SET balance = balance - 100 WHERE id = 42 /*traceparent=00-4bf92f3577b34da6a3ce929d0e0e4736-00f067aa0ba902b7-01*/;
Because PostgreSQL includes these SQL comments in the pg_stat_activity.query field, our Go agent can extract the comment when it resolves metadata for a blocked PID.
Using the regular expression parser, the agent extracts the traceparent, parses it into a valid OpenTelemetry SpanContext, and creates a child span representing the database lock wait.
Because this trace representation is created after the event has already finished, we use the start and end timestamps recorded by the kernel to backdate the span.
This backdated span is sent directly into your tracing pipeline. When a developer inspects a slow transaction, they will see the application spans, the client-side database query span, and nested underneath, a span showing the exact lock wait duration, the wait event type (e.g., relation or transactionid), and the query statement that was blocking it.
Standardizing Delivery with the OpenTelemetry Collector
The Go agent emits traces using OTLP over gRPC. To manage trace routing, batching, and processing without adding load to the agent, we run a local OpenTelemetry Collector daemon.
The collector handles trace transport, runs batch processors to group events, and detects host system resource metadata (such as the database instance hostname) to append as resource tags.
Below is a production-grade collector configuration that routes these spans to Grafana Tempo:
Production Alerting and Operational Playbooks
With traces in place, we can configure alerting. We have two main patterns of database lock issues:
- Micro-Contention: High-frequency, short-duration lock waits (e.g., 20ms waits occurring 100 times per second). While these do not warrant immediate page alerts, they indicate database tuning opportunities (such as adding missing indexes to speed up foreign key checks).
- Lock Storms: Long-duration blocks (exceeding 2 seconds) that build up quickly and exhaust database connection pools. This requires immediate intervention.
To handle lock storms, the Go agent exposes a Prometheus metrics endpoint with the cumulative counter pg_lock_wait_duration_seconds_sum. We can write a Prometheus alert rule to flag when our database backends spend more than 5 seconds in aggregate sleeping on locks within a 1-minute window.
When this alert fires in your Slack channel or pager, follow this incident response playbook:
- Open your APM tracing interface (e.g., Honeycomb or Grafana) and filter for spans containing the name
pg_lock_wait. - Sort the spans by duration to find the longest-running waits.
- Inspect the span attributes:
- Identify the blocked query and its transaction context.
- Look at
pg.blocking_pidandpg.blocking_statement.
- If you find the blocking process is executing a slow sequential scan (often due to a missing index) or holds a lock open while waiting for an external HTTP request to complete, you can terminate it.
- Log into the database console and run:
SELECT pg_cancel_backend(blocking_pid); -- Or if the process is unresponsive: SELECT pg_terminate_backend(blocking_pid); - The blocked threads will immediately acquire their locks and finish execution, resolving the cascading slowdown.
Conclusion
Database locks and wait events are a common source of performance issues in production. By moving past traditional, resource-intensive polling mechanisms and using Linux kernel tracepoints via eBPF, we can trace lock contention with low overhead. Stitching these events back into application distributed traces using SQLCommenter comments transforms database logs into actionable observability data. Instead of guessing which transaction caused a database lockup, developers can trace lock events directly to the line of code that triggered them.