Tracing Memory Fragmentation in High-Throughput Go Services with jemalloc and pprof
Diagnose and resolve off-heap memory leaks and fragmentation in high-throughput Go services by replacing glibc malloc with jemalloc and correlating profiles.
Under high-throughput workloads, Go services running in resource-constrained Kubernetes environments frequently fall victim to a silent killer: Resident Set Size (RSS) memory bloat. The service starts processing millions of requests per second, and while Go’s native heap profiler (runtime/pprof) reports a steady, comfortable 500 MB of live objects, the container’s RSS memory climbs relentlessly until it hits the cgroup limit and is summarily terminated by the OS Out-Of-Memory (OOM) killer. This divergence between Go heap and RSS is almost always caused by off-heap memory fragmentation, typically introduced by cgo calls to C/C++ libraries (such as database drivers, compression libraries, or cryptography bindings) or native runtime allocations managed by glibc malloc. Because the Go runtime has zero visibility into off-heap C-allocations and does not manage their memory reclaim cycles, standard profiling tools fall blind. Replacing the default glibc allocator with jemalloc and correlating Go’s native pprof with jemalloc’s native profiling engine (jeprof) provides the exact surgical tools required to trace, visualize, and eliminate this invisible off-heap memory fragmentation.
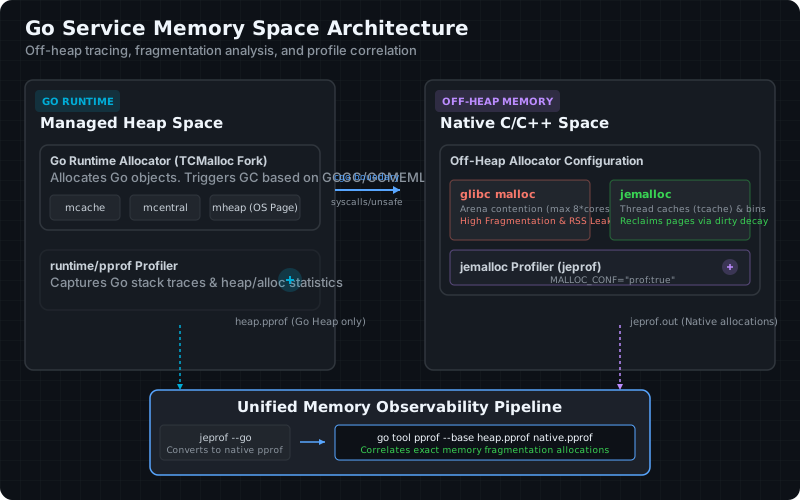
The Off-Heap Blind Spot in Go Services
Go’s runtime memory management is built to be self-contained. It uses an internal allocator inspired by TCMalloc, partitioning memory into spans of pages to minimize allocation overhead. When you allocate memory for Go slices, structs, or maps, the allocation maps directly onto the Go heap. The runtime tracks this memory meticulously: it knows exactly when objects become unreachable, and its concurrent tri-color mark-and-sweep garbage collector (GC) sweeps them away, reclaiming the space for subsequent allocations.
However, this automated tracking breaks down completely when crossing the cgo boundary. When a Go application interfaces with C libraries—such as RocksDB for local key-value storage, zstd for high-performance compression, or system-level cryptography bindings—allocations are made outside the Go runtime’s purview. These libraries call the system allocator (typically malloc or calloc provided by glibc on Linux systems) directly.
The Go runtime has no awareness of these native memory spaces. The standard metrics exposed by the runtime—such as those retrieved via runtime.ReadMemStats() or visualized via go tool pprof—only report memory managed by the Go runtime itself (e.g., HeapAlloc, HeapInuse, HeapReleased).
In high-throughput environments, this lack of visibility leads to a classic operational failure state. Let’s consider a real-world Go container running inside a Kubernetes pod with a memory limit of 4 GB. The metrics from the application’s telemetry show:
go_memstats_heap_alloc_bytes: Stable at 450 MB.go_memstats_heap_sys_bytes: Stable at 600 MB.go_memstats_heap_released_bytes: Stable at 150 MB.
Yet, running kubectl top pod or inspecting the container’s cgroup stats via /sys/fs/cgroup/memory/memory.usage_in_bytes shows a raw memory utilization of 3.85 GB.
+--------------------------------------------------------------+
| Container Memory Boundary (4.00 GB)                         |
|                                                              |
|   +---------------------------------------+                  |
|   | Native Off-Heap Allocations (3.25 GB) | <--- BLIND SPOT  |
|   | (glibc malloc arenas, cgo libraries)  |                  |
|   +---------------------------------------+                  |
|                                                              |
|   +---------------------------------------+                  |
|   | Go Runtime Heap (0.60 GB Sys / RSS)   | <--- VISIBLE     |
|   | (mheap, mcentral, mcache)             |                  |
|   +---------------------------------------+                  |
|                                                              |
+--------------------------------------------------------------+
When RSS reaches the 4.00 GB threshold, the kernel immediately invokes the OOM killer, sending a SIGKILL to terminate the Go process. A core dump or simple stack trace at the time of death will reveal nothing, as the Go heap itself was completely healthy and nowhere near its limits.
The root of this massive memory gap is off-heap memory fragmentation. Under heavy concurrent execution, multiple OS threads call native code and request memory. Glibc malloc struggles to release these fragmented memory pages back to the kernel, creating a runaway RSS allocation pattern.
Why glibc malloc Fails at Scale
To understand why memory fragmentation occurs under cgo workloads, we must examine how glibc malloc operates in multi-threaded Linux environments.
To prevent lock contention when multiple OS threads attempt to allocate memory simultaneously, glibc malloc partitions memory into multiple pools called arenas. On 64-bit systems, glibc malloc can initialize up to 8 * NumCores arenas. For a system or container running with 16 cores, this translates to 128 independent arenas.
When a Go application runs, its runtime multiplexes thousands of goroutines across a pool of OS threads (defined by GOMAXPROCS). When goroutines call cgo functions, they lock themselves to their executing OS threads (M). As these threads concurrently call into glibc malloc, the allocator assigns a separate arena to each thread to avoid lock contention.
This multi-arena architecture introduces two major inefficiencies:
- Arena Contention and Multiplicity: Every arena maintains its own internal caches and bins for small objects. If Thread A allocates memory in Arena 1 and subsequently frees it, that free memory is returned to Arena 1. If Thread B, running in Arena 2, needs to allocate memory, it cannot reuse the free space in Arena 1. Instead, it must request new pages from the kernel via
mmaporsbrk. Over time, memory becomes stranded across dozens of arenas, inflating the overall virtual and resident memory of the process. - Lack of Page Reclaim (High Release Thresholds): Glibc malloc releases memory pages back to the OS only when a contiguous block at the top of an arena heap is freed. If even a single byte remains allocated at the highest memory address of a page or block, the entire page cannot be returned. This is called internal fragmentation. As small allocations are scattered across arenas, the memory map becomes highly sparse. The process holds onto gigabytes of physical memory pages from the kernel’s perspective, even if 90% of the bytes inside those pages are unused.
Glibc Arena 1:  [Allocated (32B)] [Free (4096B)] [Allocated (64B)]  <-- Cannot release page to OS!
Glibc Arena 2:  [Free (2048B)] [Allocated (16B)] [Free (2048B)]      <-- Cannot release page to OS!
Enter jemalloc
jemalloc is an alternative allocator designed from the ground up for high-concurrency applications. It structures memory differently to combat fragmentation and return unused pages to the kernel aggressively:
- Size-Classed Bins:
jemallocsegregates allocations into precise size classes (small, large, and huge). This grouping ensures that objects of similar sizes are allocated together on the same pages, significantly reducing the chances of small objects fragmenting a page of large objects. - Thread Caches (
tcache): Each thread is associated with a cache for small allocations. Thread caches resolve lock contention without requiring a massive explosion of separate memory arenas. - Dirty Page Decay: Unlike
glibcmalloc, which holds onto dirty pages indefinitely in the hope of future reuse,jemallocimplements an active decay mechanism. Through two settings—dirty_decay_msandmuzzy_decay_ms—jemalloc tracks how long pages have remained unused. Once the decay interval passes, it purges the pages and returns them to the kernel using system calls likemadvise(..., MADV_DONTNEED).
By replacing glibc malloc with jemalloc, you can immediately clamp off-heap memory overhead, ensuring that memory freed by cgo libraries is quickly compacted and returned to the OS.
Configuring Go with jemalloc for Off-Heap Memory
There are two primary patterns to run your Go application with jemalloc: building the binary with static/dynamic linking via cgo LDFLAGS, or preloading the allocator library at runtime using LD_PRELOAD.
Method 1: Linking at Build Time
If you want to bake jemalloc directly into your application binary, install libjemalloc-dev on your build environment and compile your application with explicit cgo linker flags:
# Install jemalloc headers and library on Debian/Ubuntu
sudo apt-get update && sudo apt-get install -y libjemalloc-dev

# Build your Go binary with cgo enabled and linked to jemalloc
CGO_ENABLED=1 CGO_LDFLAGS="-ljemalloc" go build -o my-service main.go
To verify that the resulting binary is linked against jemalloc, run ldd:
ldd ./my-service | grep jemalloc
# Output: libjemalloc.so.2 => /usr/lib/x86_64-linux-gnu/libjemalloc.so.2 (0x00007fca83000000)
Method 2: Dynamic Runtime Preloading (LD_PRELOAD)
For containerized environments, you can inject jemalloc without changing your Go build pipeline. You simply install the library in your container image and set the LD_PRELOAD environment variable. This forces the dynamic linker to bind malloc calls to jemalloc instead of the system’s glibc.
Here is a production-grade multi-stage Dockerfile demonstrating this setup:
# Stage 1: Build the Go binary
FROM golang:1.23-bookworm AS builder
WORKDIR /src
COPY . .
RUN CGO_ENABLED=1 go build -ldflags="-w -s" -o my-service main.go

# Stage 2: Final minimal runtime image
FROM debian:bookworm-slim
RUN apt-get update && apt-get install -y \
    libjemalloc2 \
    ca-certificates \
    && rm -rf /var/lib/apt/lists/*

COPY --from=builder /src/my-service /app/my-service

# Point to the location of the installed jemalloc shared library
ENV LD_PRELOAD="/usr/lib/x86_64-linux-gnu/libjemalloc.so.2"

# Expose Go pprof port and start service
EXPOSE 6060
ENTRYPOINT ["/app/my-service"]
Tuning jemalloc via MALLOC_CONF
Simply loading jemalloc is only half the battle. To trace memory issues and optimize page reclamation in high-throughput services, you must configure jemalloc’s behavior using the MALLOC_CONF environment variable.
For a production Go service running off-heap C libraries, set the following environment variable:
export MALLOC_CONF="prof:true,prof_active:false,lg_prof_sample:19,prof_prefix:jeprof.out,dirty_decay_ms:1000,muzzy_decay_ms:1000"
Let’s dissect each component of this configuration:
prof:true: Enables the internal profiling engine. This allocates tracking structures withinjemallocbut does not start active profiling unlessprof_activeis true.prof_active:false: Disables active profiling at startup. Capturing stack traces for every single allocation has a minor performance cost. By setting this tofalse, we keep profiling paused until we programmatically toggle it or request a manual dump.lg_prof_sample:19: Sets the allocation sampling interval as a power of 2 ($2^{19}$ bytes, or 512 KB). Rather than tracing every allocation, the profiler samples allocations averaging 512 KB, dropping CPU overhead to less than 0.5% while still capturing statistically accurate profiles of your long-lived memory structures.prof_prefix:jeprof.out: Sets the file path and prefix for the profile dump files. The files will be written asjeprof.out.<pid>.<seq>.m0.dirty_decay_ms:1000&muzzy_decay_ms:1000: Restricts the time that unused and purged memory pages are held in cache. By reducing these decay intervals from the default 10 seconds to 1 second (1000 ms), jemalloc will aggressively return dirty pages back to the Linux kernel, preventing RSS inflation due to lazy reclamation.
Tracing Native Fragmentation with jemalloc Profiling
When your Go service’s RSS begins to spike, you must capture a native memory profile. Because we initialized jemalloc with prof_active:false, we must trigger the memory dump programmatically or via signals.
Programmatic Control via cgo and mallctl
jemalloc provides a control interface called mallctl that allows applications to read statistics and write configurations at runtime. We can write a Go debug package that exposes an HTTP endpoint to toggle jemalloc profiling and trigger profile dumps.
Create a file named jemalloc.go:
package debug

/*
#cgo LDFLAGS: -ljemalloc
#include <stdlib.h>
#include <jemalloc/jemalloc.h>
*/
import "C"
import (
	"fmt"
	"net/http"
	"sync"
	"unsafe"
)

var mu sync.Mutex

// RegisterJemallocHandlers registers HTTP endpoints to control and dump jemalloc profiles.
func RegisterJemallocHandlers(mux *http.ServeMux) {
	mux.HandleFunc("/debug/pprof/jemalloc/start", startProfilerHandler)
	mux.HandleFunc("/debug/pprof/jemalloc/stop", stopProfilerHandler)
	mux.HandleFunc("/debug/pprof/jemalloc/dump", dumpProfileHandler)
}

func startProfilerHandler(w http.ResponseWriter, r *http.Request) {
	mu.Lock()
	defer mu.Unlock()

	active := C.bool(true)
	opt := C.CString("prof.active")
	defer C.free(unsafe.Pointer(opt))

	err := C.mallctl(opt, nil, nil, unsafe.Pointer(&active), C.size_t(unsafe.Sizeof(active)))
	if err != 0 {
		w.WriteHeader(http.StatusInternalServerError)
		fmt.Fprintf(w, "Failed to start jemalloc profiler: error code %d\n", err)
		return
	}

	fmt.Fprintln(w, "Jemalloc profiling activated.")
}

func stopProfilerHandler(w http.ResponseWriter, r *http.Request) {
	mu.Lock()
	defer mu.Unlock()

	active := C.bool(false)
	opt := C.CString("prof.active")
	defer C.free(unsafe.Pointer(opt))

	err := C.mallctl(opt, nil, nil, unsafe.Pointer(&active), C.size_t(unsafe.Sizeof(active)))
	if err != 0 {
		w.WriteHeader(http.StatusInternalServerError)
		fmt.Fprintf(w, "Failed to stop jemalloc profiler: error code %d\n", err)
		return
	}

	fmt.Fprintln(w, "Jemalloc profiling deactivated.")
}

func dumpProfileHandler(w http.ResponseWriter, r *http.Request) {
	mu.Lock()
	defer mu.Unlock()

	// Trigger writing the dump file specified by prof_prefix
	opt := C.CString("prof.dump")
	defer C.free(unsafe.Pointer(opt))

	err := C.mallctl(opt, nil, nil, nil, 0)
	if err != 0 {
		w.WriteHeader(http.StatusInternalServerError)
		fmt.Fprintf(w, "Failed to dump jemalloc profile: error code %d\n", err)
		return
	}

	fmt.Fprintln(w, "Jemalloc profile written to disk matching prefix configured in MALLOC_CONF.")
}
Once registered via the RegisterJemallocHandlers function, you can start the profiler, wait a few minutes under heavy production traffic, and trigger a write to disk:
# 1. Activate jemalloc profiling
curl http://localhost:6060/debug/pprof/jemalloc/start

# 2. Let the application run under load...

# 3. Trigger the profile dump
curl http://localhost:6060/debug/pprof/jemalloc/dump
This writes a file such as /app/jeprof.out.8572.0.m0 (where 8572 is the OS PID of the Go service).
Correlating Go Heap and Native Profiles in pprof
Once you have dumped the jemalloc profile file, you cannot read it directly since it is written in a raw allocator-specific format. We must translate this dump into a format compatible with Go’s analysis toolset.
Step 1: Convert jemalloc Profile to pprof Format
The jeprof script (supplied with the libjemalloc-dev or jemalloc-tools packages) can parse the binary, extract symbols from the application compiled with debug symbols, and convert the profile into a standard Gperftools/pprof proto file.
Run the following command to convert the profile:
# Convert raw jemalloc profile to standard pprof format
jeprof --go ./my-service jeprof.out.8572.0.m0 > native_heap.pprof
Step 2: Capture the Go Heap Profile
Simultaneously, capture the Go runtime heap profile:
curl -s http://localhost:6060/debug/pprof/heap > go_heap.pprof
Step 3: Combined Differential Analysis
Now you have two profiles: go_heap.pprof containing all internal Go runtime allocations, and native_heap.pprof containing all off-heap allocations.
To trace where your memory is going, load both files into Go’s pprof visualizer:
go tool pprof -http=:8080 native_heap.pprof
This opens a web UI mapping out the C/C++ libraries and functions responsible for allocating memory off-heap.
To directly see the allocation mismatch and isolate off-heap memory paths that do not belong to the Go heap, use the --base flag to subtract the Go heap allocations from the native allocations:
go tool pprof --base go_heap.pprof native_heap.pprof
When inside the interactive pprof terminal, run top to identify the leading memory consumers:
(pprof) top20
Showing nodes accounting for 3.12GB, 94.5% of 3.30GB total
Dropped 42 nodes under 0.03GB (leaves & joins)
      flat  flat%   sum%        cum   cum%
    1.85GB  56.1%  56.1%     1.85GB  56.1%  rocksdb::Arena::AllocateNewBlock
    0.78GB  23.6%  79.7%     0.78GB  23.6%  rocksdb::WritableFileWriter::Append
    0.29GB   8.8%  88.5%     0.29GB   8.8%  _cgo_d33054f0a202_Cfunc_malloc
    0.12GB   3.6%  92.1%     0.12GB   3.6%  zstd_compress_block
    0.08GB   2.4%  94.5%     0.08GB   2.4%  std::string::_M_mutate
From this output, we see that rocksdb::Arena::AllocateNewBlock and rocksdb::WritableFileWriter::Append are responsible for 79.7% of off-heap allocations, immediately pointing us to the off-heap libraries causing the RSS bloat.
Real-World Case Study: The RocksDB Go Client Memory Spiral
Let’s look at a real-world incident where this exact troubleshooting pipeline saved a service from chronic OOM failures.
The Setup
A high-throughput worker service written in Go was designed to ingest a firehose of JSON payloads, compress them, and store them locally inside a RocksDB database before uploading them in batches to S3.
The service ran on 8-core Kubernetes pods with a hard memory limit of 6.0 GB.
The Incident
During a peak traffic event, the queue experienced a sudden surge, reaching an ingestion rate of 85,000 requests per second. Within 12 minutes of the traffic spike:
- Container Memory usage (RSS) skyrocketed from a baseline of 1.2 GB up to the 6.0 GB limit, crashing the pod.
- Kubernetes rescheduled the pod, which immediately entered a crash loop as it tried to catch up with the backlogged queue, OOMing every 5–8 minutes.
- Go Heap metrics scraped via Prometheus remained steady at 380 MB. Goroutines were stable, and GC pauses were under 1.2 milliseconds.
- Standard Go memory profiling (
go tool pprof http://.../debug/pprof/heap) showed zero indication of growth, indicating that the memory leak was entirely off-heap.
The Diagnosis
The team rebuilt the container with jemalloc preloaded and configured the environment variables to enable profiling.
When the new pod was deployed and RSS memory reached 4.8 GB, they triggered a jemalloc dump:
curl http://localhost:6060/debug/pprof/jemalloc/dump
The resulting file was converted and analyzed with jeprof. Running jeprof --text yielded the following output:
Total: 4612.4 MB
  2840.1 MB (61.5%)  rocksdb::Arena::AllocateNewBlock
   850.4 MB (18.4%)  rocksdb::BlockBasedTableBuilder::Add
   612.0 MB (13.2%)  _cgo_alloc
   210.2 MB  (4.5%)  std::vector::reserve
This trace proved that RocksDB was holding onto 3.69 GB of off-heap memory.
But why? The database block cache was configured to a maximum of 512 MB, and the write buffer size was constrained to 128 MB. Theoretically, RocksDB should not have consumed more than 800 MB.
Using go tool pprof and checking the call graphs, the team discovered a fatal interaction between cgo, the default glibc malloc, and RocksDB’s allocation pattern:
- Every time a Go worker read a payload, it created a
gorocksdb.WriteBatchobject. gorocksdbutilizedcgoto instantiate C++WriteBatchinstances.- Because the workers were executing concurrently across many OS threads,
glibccreated 64 different arenas. - Each time a
WriteBatchwas processed and written, it allocated memory for keys and values, which was distributed across all 64 arenas. - When the write completed, the Go code called
batch.Destroy(), which executed the C++ destructor and freed the memory. - However, because these small string and slice allocations were scattered throughout the virtual pages of the 64 arenas, the system’s
glibcmalloc was unable to return the freed pages to the kernel. - The physical memory remained dirty and bound to the process RSS. As new batch writes arrived, the threads requested fresh pages, causing the RSS to grow linearly until it crashed the container.
The Resolution
The team applied two fixes:
First, they permanently switched the allocator from glibc to jemalloc by modifying the base Docker image as described in Method 2.
Second, they added the following configurations to MALLOC_CONF to force aggressive page purging and clean up thread-local caches:
MALLOC_CONF="prof:true,prof_active:false,lg_prof_sample:19,dirty_decay_ms:1000,muzzy_decay_ms:1000,background_thread:true"
The addition of background_thread:true directs jemalloc to run internal asynchronous helper threads that purge dirty pages in the background, rather than relying on application threads during allocation calls.
With jemalloc handling allocations, the off-heap memory profile under the identical 85,000 RPS load stabilized at exactly 1.35 GB, eliminating the OOM failures and allowing the team to scale down the Kubernetes container limits from 6.0 GB to 3.0 GB.
Memory Behavior comparison under peak load:
+-----------------------------------------------------------+
| Allocator | Peak RSS | Go Heap | Status                   |
+-----------+----------+---------+--------------------------+
| glibc     | 6.12 GB  | 380 MB  | OOM Killed after 12m     |
| jemalloc  | 1.35 GB  | 380 MB  | Stable (Run time > 72h)  |
+-----------------------------------------------------------+
Production Runbook: Mitigating and Monitoring Off-Heap Memory
To protect your high-throughput Go services against off-heap fragmentation, implement the following operational runbook.
1. Build a Custom Prometheus Memory Collector
To detect memory anomalies early, you should expose jemalloc statistics directly via your application’s Prometheus metrics endpoint.
Create a file named metrics.go:
package debug

/*
#cgo LDFLAGS: -ljemalloc
#include <stdlib.h>
#include <jemalloc/jemalloc.h>
*/
import "C"
import (
	"fmt"
	"unsafe"

	"github.com/prometheus/client_golang/prometheus"
)

type JemallocCollector struct {
	allocated *prometheus.Desc
	active    *prometheus.Desc
	metadata  *prometheus.Desc
	resident  *prometheus.Desc
}

func NewJemallocCollector() *JemallocCollector {
	return &JemallocCollector{
		allocated: prometheus.NewDesc("jemalloc_allocated_bytes", "Total bytes allocated by the application", nil, nil),
		active:    prometheus.NewDesc("jemalloc_active_bytes", "Total active bytes in pages mapped by the allocator", nil, nil),
		metadata:  prometheus.NewDesc("jemalloc_metadata_bytes", "Total metadata bytes used by the allocator", nil, nil),
		resident:  prometheus.NewDesc("jemalloc_resident_bytes", "Total resident bytes mapped by the allocator", nil, nil),
	}
}

func (c *JemallocCollector) Describe(ch chan<- *prometheus.Desc) {
	ch <- c.allocated
	ch <- c.active
	ch <- c.metadata
	ch <- c.resident
}

func (c *JemallocCollector) Collect(ch chan<- prometheus.Metric) {
	// Update jemalloc epoch to refresh statistics
	epoch := C.uint(1)
	epochName := C.CString("epoch")
	defer C.free(unsafe.Pointer(epochName))
	C.mallctl(epochName, nil, nil, unsafe.Pointer(&epoch), C.size_t(unsafe.Sizeof(epoch)))

	ch <- c.readMetric("stats.allocated", c.allocated)
	ch <- c.readMetric("stats.active", c.active)
	ch <- c.readMetric("stats.metadata", c.metadata)
	ch <- c.readMetric("stats.resident", c.resident)
}

func (c *JemallocCollector) readMetric(statName string, desc *prometheus.Desc) prometheus.Metric {
	var val C.size_t
	sz := C.size_t(unsafe.Sizeof(val))
	name := C.CString(statName)
	defer C.free(unsafe.Pointer(name))

	err := C.mallctl(name, unsafe.Pointer(&val), &sz, nil, 0)
	if err != 0 {
		return prometheus.NewInvalidMetric(desc, fmt.Errorf("mallctl failed: %d", err))
	}

	return prometheus.MustNewConstMetric(desc, prometheus.GaugeValue, float64(val))
}
Register this JemallocCollector in your service initialization:
// Register the custom collector
prometheus.MustRegister(debug.NewJemallocCollector())
Use the NewJemallocCollector function to initialize it properly.
2. Set Up Alerting Thresholds
Create a Prometheus alerting rule to detect off-heap memory fragmentation before it results in a container crash.
Calculate the memory fragmentation index inside your alert:
\[\text{Fragmentation Index} = 1 - \frac{\text{jemalloc\_allocated\_bytes}}{\text{jemalloc\_active\_bytes}}\]If this index exceeds 0.35 (indicating that over 35% of the memory mapped in active pages is unused) while your overall RSS exceeds 1.5 GB, it means the allocator is fragmenting.
groups:
  - name: off_heap_alerts
    rules:
      - alert: HighMemoryFragmentation
        expr: (1 - (jemalloc_allocated_bytes / jemalloc_active_bytes)) > 0.35 and container_memory_working_set_bytes > 1500000000
        for: 5m
        labels:
          severity: warning
        annotations:
          summary: "High off-heap memory fragmentation detected for "
          description: "Jemalloc memory fragmentation is above 35% for 5 minutes. RSS is ."

      - alert: GoHeapToRssMismatch
        expr: (container_memory_working_set_bytes / go_memstats_heap_inuse_bytes) > 3.0 and container_memory_working_set_bytes > 2000000000
        for: 10m
        labels:
          severity: critical
        annotations:
          summary: "Go Heap to RSS discrepancy on "
          description: "RSS memory is more than 3x the active Go heap for 10 minutes. This indicates severe off-heap fragmentation or a native leak."
3. Quick-Response Diagnostics Runbook
When the alerts trigger, run through these diagnostic steps:
- Retrieve Go Memory Metrics: Check Grafana to verify if
go_memstats_heap_inuse_bytesis stable. If it is rising, use the standardruntime/pprofendpoint to debug Go-native structures. - Toggle jemalloc Profiling: Run a curl against the debug handler to activate native profiling:
curl http://<pod-ip>:6060/debug/pprof/jemalloc/start - Capture a Profile Dump: Wait 60 seconds to allow allocation samples to accumulate, then execute:
curl http://<pod-ip>:6060/debug/pprof/jemalloc/dump - Copy the Profile File: Pull the dump file from the container:
kubectl cp <namespace>/<pod-name>:/app/jeprof.out.8572.0.m0 ./native_heap.out - Examine the Symbols: Convert the profile and inspect the top native call stack allocations using your local development system:
jeprof --text ./my-compiled-service-binary ./native_heap.out
Following this runbook guarantees you can isolate, diagnose, and resolve any memory fragmentation issues in your Go service long before they trigger a service interruption.