Tracing Linux Epoll Starvation and Thread Pool Congestion in High-Throughput Node.js Services via eBPF
Diagnose event loop lag, epoll_wait starvation, and libuv thread pool congestion in high-throughput Node.js microservices using eBPF probes.
You are running a high-throughput Node.js API gateway processing 45,000 requests per second. Suddenly, your P99 latency spikes from a baseline of 15 milliseconds to over 4,000 milliseconds. CPU utilization hover stably at 50%, memory consumption is flat, and V8 garbage collection cycles are finishing in under 8 milliseconds. Traditional Application Performance Monitoring (APM) agents register a massive increase in event loop lag, but they fail to answer the critical questions: is the JavaScript execution thread blocked by synchronous operations, or is libuv’s internal worker pool starved due to a concurrent wave of cryptographic hashing, filesystem interactions, or blocking DNS resolutions? When conventional profilers fail because they inject destructive overhead or cannot cross the user-kernel boundary, eBPF (Extended Berkeley Packet Filter) allows you to introspect the Linux kernel’s system calls and task scheduler in real-time, pinpointing the exact root cause of your service degradation with near-zero runtime overhead.
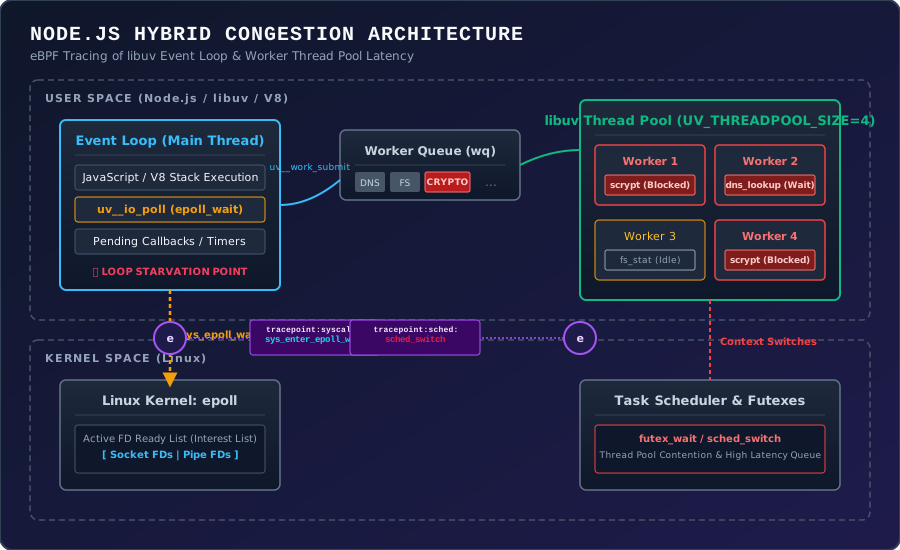
Anatomy of Node.js Congestion: Event Loop vs. Worker Pool
To diagnose high-latency events in a Node.js process, you must first separate the system into its two execution paradigms: the single-threaded JavaScript Event Loop and the multi-threaded libuv Worker Pool.
The Event Loop is the heart of a Node.js process. It runs on a single OS thread (the main thread) and executes V8 JavaScript compilation, callbacks, and event dispatching. When there are no pending JavaScript tasks, timers, or microtasks, the Event Loop halts execution and yields control to the Linux kernel by blocking on the epoll_wait system call. The kernel puts this thread to sleep, waking it up only when incoming network packets arrive on registered socket file descriptors or when timers expire.
However, because the Event Loop is single-threaded, any synchronous JavaScript operation—such as parsing a 20MB JSON payload, sorting a large array, or running nested loops—keeps the main thread busy. The process remains in user space, unable to transition to the kernel to call epoll_wait. The kernel continues to queue incoming TCP connection requests in the socket’s backlog queue, but Node.js cannot accept them. This is Event Loop Starvation.
In contrast, libuv offloads blocking and expensive operations (such as file I/O, DNS resolution via getaddrinfo, compression via zlib, and cryptography via crypto) to a dedicated pool of background thread workers. By default, the pool size (UV_THREADPOOL_SIZE) is set to 4. When you call an asynchronous cryptographic function like crypto.scrypt(), libuv wraps this operation in a work request and pushes it to a global queue (wq). The worker threads pull from this queue, execute the blocking task in C++, and write a completion notification to a pipe. The Event Loop, during its poll phase, reads this notification and executes the associated JS callback.
If your service receives a burst of concurrent requests that invoke these offloaded APIs, all 4 worker threads will become saturated. The 5th, 6th, and 100th tasks will wait in libuv’s internal queue. While the Event Loop itself remains completely responsive, yielding to epoll_wait and accepting new connections, the asynchronous operations executed by the worker pool experience high latency. This is Thread Pool Congestion.
Traditional profiling tools like Node’s --prof (V8 CPU profiler) fail to identify thread pool queuing delays because they only profile active CPU cycles of running threads. They cannot measure the duration a task spent waiting in a user-space queue, nor can they tell if kernel threads are context-switched out due to scheduler decisions. eBPF provides the required observability by tracing both the syscall latency of epoll_wait on the main thread and the scheduler latency (sched_switch and sched_wakeup) of the libuv worker threads.
The Silent Killer: Thread Pool Saturation
To see how easily the libuv worker pool can be saturated, consider the following Fastify server. It exposes a route that performs password verification using the asynchronous crypto.scrypt function, along with a standard health check route that reads metadata from the disk.
When load testing the /api/auth/login endpoint with 100 concurrent requests, the P99 latency of the /health route spikes to over 2,000 milliseconds, even though reading the status.txt file takes less than 1 millisecond of raw disk execution time.
Because UV_THREADPOOL_SIZE defaults to 4, only four scrypt hashing tasks run concurrently. The remaining 96 auth requests sit in libuv’s task queue. When a user requests /health, the asynchronous fs.readFile task is pushed to the end of that same queue. It must wait for the CPU-intensive cryptography operations ahead of it to complete before a worker thread becomes available to read the disk.
Hooking into the Kernel: Why eBPF?
When troubleshooting these performance issues in production, developers often reach for strace or user-space CPU profilers.
Using strace to intercept system calls like epoll_wait or futex under high throughput is dangerous. Every time a thread issues a syscall, strace intercepts it via ptrace(2), forcing a context switch to the tracer process and back. In high-traffic scenarios, running strace -c or strace -T on a Node.js process processing thousands of requests per second can degrade performance by 80% to 95%, often crashing the application or triggering load-balancer health-check timeouts.
User-space profilers, on the other hand, struggle to cross the language boundary. A CPU profiler running inside the V8 engine is unaware of the state of the libuv threads. It cannot measure kernel scheduler latencies or determine if a thread is blocked waiting for a futex (lock contention).
eBPF solves this by compiling sandboxed C-like programs into kernel bytecode, which is validated and executed directly within the Linux kernel context. It hooks into kernel tracepoints, system call entries, and scheduler events with negligible overhead.
To trace Node.js event loop behavior and libuv thread pools, we target two distinct kernel tracepoint sets:
syscalls:sys_enter_epoll_waitandsyscalls:sys_exit_epoll_wait: This allows us to measure how long the event loop thread blocks inepoll_wait. If it blocks for a long time, the event loop is idle. If it rarely callsepoll_waitbut latency is high, the loop is starved.sched:sched_wakeupandsched:sched_switch: These allow us to trace when worker threads are woken up by the main thread (usingpthread_cond_signalwhich calls thefutexsystem call) and measure how long they wait in the Linux runqueue before being scheduled onto an active CPU core.
Tracing Epoll Wait Times to Detect Event Loop Blockage
Let’s construct an eBPF program to trace the time spent by a Node.js process inside epoll_wait.
We create a kernel-space BPF script that hooks into the entry and exit tracepoints of the epoll_wait system call. The script records the timestamp when a process enters epoll_wait and calculates the duration when it exits. We store this duration in a BPF hash map, grouped by the thread group ID (TGID, representing the Process ID) and Thread ID (TID).
Here is the kernel-space BPF C program:
Now, we build the user-space Python harness using the BCC (BPF Compiler Collection) framework to compile the C code, inject it into the kernel, attach the tracepoints, and print a formatted latency histogram.
If we execute this tool against a healthy, idle Node.js process, we will see epoll_wait latencies clustered in the high millisecond ranges (e.g., 500,000 to 2,000,000 microseconds), reflecting the event loop safely sleeping while waiting for traffic.
However, if our service is experiencing active throughput load but the P99 latency is high, and the histogram shows epoll_wait latencies clustered in the microsecond range (e.g., 0 to 50 microseconds), this indicates that the event loop is never allowed to sleep. The JavaScript call stack is continuously occupied, executing code back-to-back, starving the loop from entering its poll phase to process network packets.
Tracing libuv Thread Pool Queue Delay with eBPF
To diagnose thread pool congestion, we cannot rely on epoll wait times. We must measure how long a work item, once submitted to the libuv queue, waits before a worker thread actually begins its execution.
Libuv schedules workers using pthread primitives. When uv_queue_work is called on the main thread:
- It locks a mutex.
- It pushes a task structure onto the queue
loop->wq. - It calls
pthread_cond_signalto wake up one of the worker threads sleeping on the condition variable. - The kernel marks the sleeping worker thread as
TASK_RUNNING(runnable) and inserts it into the CPU scheduling queue. - The scheduler picks up the worker thread, which then acquires the mutex, pops the work request, and runs the C++ worker function.
By hook-tracing scheduler switches, we can compute two values:
- Scheduling Delay: The time elapsed between a thread being awakened (
sched_wakeup) and actually executing on a CPU core (sched_switch). High values indicate that the OS is starved of CPU cores, causing workers to queue up at the kernel scheduler level. - Worker Execution Duration: The time spent by the worker thread running without yielding. This exposes lock-contention or heavy user-space operations blocking the worker.
Let’s write an eBPF program targeting scheduler tracepoints to compute thread scheduling delay.
Now, we create the corresponding Python script to orchestrate the tracepoints and format output metrics.
Under load, if the output of sched_latency shows high values (e.g., hundreds of milliseconds) but CPU utilization on the machine is low, it points directly to thread pool starvation where threads are waiting for futex locks due to intense synchronization contention.
If scheduling latencies are low (microsecond range) but /health endpoints are still taking seconds, the threads are running immediately when called, meaning the queue delay is entirely in user space within the libuv wq queue. To fix this, you must expand the libuv threadpool size or bypass it completely.
Production Mitigation Strategies
Once you have identified epoll starvation or thread pool congestion using eBPF, you must apply target strategies to resolve the blockage.
1. Scaling the Thread Pool (UV_THREADPOOL_SIZE)
If your profiling indicates high wait times in libuv’s queue for asynchronous tasks like crypto or zlib, you must scale the thread pool size. By default, it is set to 4. For processes running on multi-core systems, increase this value to match your workload.
Rule of thumb: Set UV_THREADPOOL_SIZE to the number of logical CPU cores if the tasks are purely CPU-bound (e.g., crypto), or up to 2x to 4x the CPU count if tasks are I/O bound (e.g., filesystem access, legacy database connections). You must set this environment variable before Node.js initializes, as libuv instantiates its threads upon startup.
export UV_THREADPOOL_SIZE=16
node server.js
2. Bypassing the Thread Pool for DNS Resolutions
By default, calling dns.lookup('api.external.com') uses the blocking getaddrinfo(3) C system call, which runs synchronously inside libuv’s thread pool. If your microservice makes thousands of HTTP calls to external APIs, getaddrinfo will completely saturate the thread pool, stalling database or disk reads.
To mitigate this, bypass dns.lookup by using non-blocking DNS resolution functions like dns.resolve4. These functions use the C-ares library, which executes non-blocking network calls directly on the Event Loop without utilizing the libuv thread pool.
3. Offloading Cryptographic / Heavy CPU Workloads to V8 Worker Threads
For heavy computational processes like password hashing or large data processing, use Node’s native worker_threads module instead of libuv’s background thread pool. V8 Worker Threads run in their own V8 isolates with separate memory spaces and their own event loops. This ensures that massive computations never interfere with the main thread’s network loop or libuv’s internal resource queues.
The following code implements these production mitigations, demonstrating how to decouple DNS queries from the thread pool and isolate heavy crypto computations using worker threads.
By switching DNS resolution to C-ares and running authentication cryptography inside V8 Worker Threads, the libuv thread pool is kept free to execute incoming filesystem writes and database connection signals.
When you apply these optimizations, rerun the eBPF tracer. You will notice that epoll_wait distributions shift back to standard millisecond ranges under load, indicating a healthy, non-starved event loop that is ready to process incoming high-throughput requests.