Tracing DNS Resolution Latency and Timeout Retries in Production Kubernetes Clusters using eBPF
Diagnose and resolve silent DNS latency spikes and conntrack timeout retries in Kubernetes clusters by writing kernel-space eBPF probes for UDP sockets.
It is 3:00 AM, and your p99 API latency has suddenly spiked from a comfortable 15 milliseconds to over 2000 milliseconds. Your API gateways are throwing HTTP 504 Gateway Timeouts, yet node CPU utilization is healthy, database queues are empty, and CoreDNS logs report sub-millisecond query durations. You are facing the classic Kubernetes DNS silent retry penalty: the deadly intersection of glibc’s parallel A/AAAA lookup queries, the default ndots:5 resolution path, and a race condition inside the host’s Netfilter connection tracking (conntrack) table. When these factors collide, the Linux kernel silently discards UDP packets, forcing the client’s resolver to stall and trigger a hard 2-second timeout retry. Application-level metrics and distributed traces only show that getaddrinfo took 2.001 seconds, leaving you in the dark. The only way to expose this silent latency thief is by dropping below the system call boundary and instrumenting the Linux socket layer and UDP send/receive paths directly using eBPF (Extended Berkeley Packet Filter).
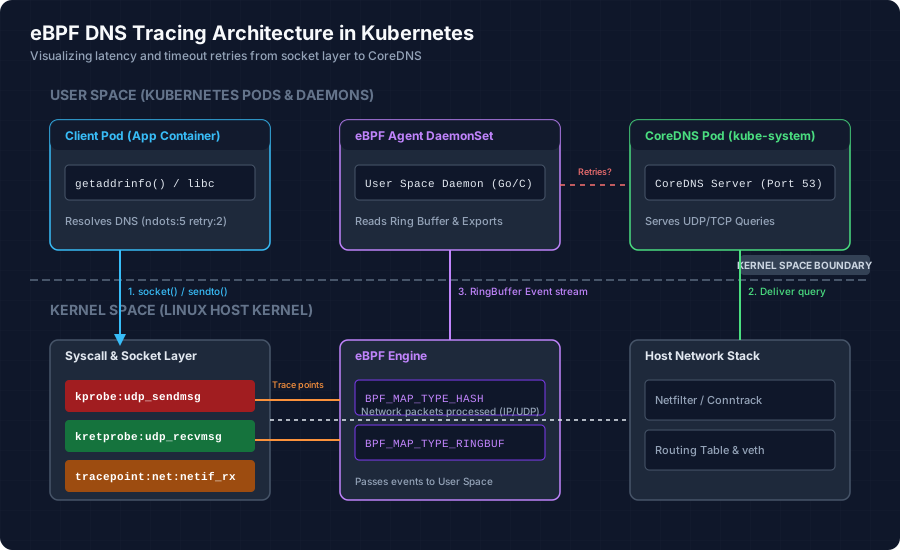
The Root Causes of K8s DNS Latency: ndots and the Conntrack Race
To understand why DNS latency manifests as a binary 2-second or 5-second penalty, we must look at how the GNU C Library (glibc) resolver interacts with the kernel netfilter conntrack table in a standard Kubernetes networking topology.
The ndots:5 Multiplier Effect
By default, Kubernetes configures the /etc/resolv.conf of every pod with options ndots:5 and a set of search domains. When an application attempts to resolve an external domain like api.stripe.com, glibc inspects the number of dots in the name. Since api.stripe.com contains only two dots (which is less than 5), the resolver does not treat it as an absolute domain name. Instead, it systematically appends the search paths configured in the cluster:
api.stripe.com.production.svc.cluster.localapi.stripe.com.svc.cluster.localapi.stripe.com.cluster.localapi.stripe.com(finally queried as an absolute name)
This means a single DNS lookup triggers up to 8 UDP queries (A and AAAA records for each search path) before resolving.
The Parallel Query Conntrack Race
Modern applications call getaddrinfo() to resolve names, which initiates both A (IPv4) and AAAA (IPv6) queries in parallel. In UDP, this results in two packets sent almost simultaneously from the same socket or adjacent sockets to the CoreDNS service IP.
As these packets traverse the virtual ethernet interface (veth) of the container to the host network stack, the netfilter connection tracking module (nf_conntrack) processes them. Since UDP is connectionless, conntrack must build state for these flows.
When the A and AAAA query packets are sent simultaneously:
- Both packets are parsed by conntrack.
- If no conntrack entry exists for this source-destination tuple, conntrack allocates a new unconfirmed conntrack table entry for each packet.
- Because the queries are sent at the exact same microsecond, they often resolve to the same CoreDNS endpoint. The destination NAT (DNAT) translation attempts to assign them to the same destination service IP and port (53).
- When the kernel attempts to confirm the connection tracking entries via
__nf_conntrack_confirm(), only one packet successfully acquires the conntrack hash table spinlock and registers. - The second packet, trying to confirm an identical tuple concurrently, fails validation. The kernel identifies this as a conflict and silently discards the packet, incrementing the
insert_failedcounter in netfilter.
The application container never receives a response for the dropped query. Because it was sent over UDP, there is no TCP-level retransmission. The application must wait until the resolver’s internal timeout expires—which defaults to 2 seconds in standard Alpine/glibc configurations—before retrying the query.
Why Traditional Observability Tools Fail
Standard observability metrics are blind to this behavior because of where the drop occurs.
- CoreDNS Logs & Prometheus Metrics: CoreDNS only registers queries that successfully pass through the host network stack and reach the DNS daemon’s socket. Since the kernel drops the UDP query before or during host bridge traversal, CoreDNS is completely unaware of the query. CoreDNS reports p99 latencies of less than 1ms while your application experiences 2000ms response times.
- Node Exporter Conntrack Metrics: While
node_nf_conntrack_entriescan tell you if the conntrack table is full, it doesn’t surface insertion failures due to races on a per-socket basis. - Application APM (OpenTelemetry, Datadog): APM libraries wrap HTTP/TCP client libraries. They measure HTTP handshake latency or connection times. If a DNS resolution stalls, it registers simply as a slow TCP connection setup or socket timeout.
eBPF solves this by instrumenting the kernel socket buffer structure (sk_buff) at the exact boundary where UDP packets are queued and sent, allowing us to map the precise lifecycle of every DNS query and correlate timeouts.
Writing the eBPF Program: Tracing Socket Events
To trace these issues in production, we can write an eBPF program that hooks into udp_sendmsg and udp_recvmsg kernel functions. By capturing the unique DNS Transaction ID (the first 2 bytes of the DNS payload) alongside the socket pointer and timing information, we can calculate resolution latencies and trace packet drops.
Here is the kernel-space C code for the eBPF program.
Now we implement the kprobe attached to udp_sendmsg to intercept outgoing UDP packets directed to port 53.
The Go User-Space Collector: Correlating Events
To read the raw events emitted by the kernel-space probes and expose metrics to our Prometheus server, we implement a Go driver utilizing the cilium/ebpf library.
For ultra-low latency scenarios, we must avoid allocation inside the read loop. Let’s optimize the parsing logic of raw DNS events inside user-space to process incoming records as fast as possible.
Production Deployment: DaemonSet and RBAC
To execute kernel-level tracing across our cluster, we run the eBPF exporter container as a Kubernetes DaemonSet. It requires specific Linux capabilities (CAP_SYS_ADMIN or CAP_BPF on kernels >= 5.8) to load programs into the kernel space, and access to the host’s /sys/kernel/debug directory to attach to kernel tracing infrastructure.
Mitigating DNS Latency: Actionable Production Playbook
When our eBPF metrics flag latency spikes around 2.0s, we can apply specific Kubernetes-native optimizations to alleviate conntrack races and search-path multiplier issues.
Mitigation 1: Single-Request-Reopen
The conntrack collision happens because glibc sends both A and AAAA packets simultaneously from the same local port. Standard Linux networking drops the second packet during conntrack initialization.
Adding the options single-request-reopen and single-request to /etc/resolv.conf fixes this behavior. With single-request-reopen set, if glibc sends two queries and the second query times out, it closes the network socket and opens a new one for the second lookup. This ensures a clean path through the host’s connection tracking table.
Mitigation 2: Optimizing ndots
We can set a custom dnsConfig in our Pod specs to set ndots:1. Doing this forces the resolver to perform an absolute lookup first instead of appending search domains, reducing the total query volume per DNS resolution.
Here is a hardened Pod template demonstrating these optimizations.
Mitigation 3: Deploying NodeLocal DNSCache
The ultimate defense against conntrack-based drops is bypassing conntrack altogether. By deploying NodeLocal DNSCache, Kubernetes runs a lightweight DNS caching agent on every node as a DaemonSet. This agent listens on a link-local IP (169.254.20.10) on a loopback interface.
Because queries go to the node itself via the loopback interface, netfilter is not involved, and conntrack connection tables are bypassed entirely.
Quick Diagnosis via bpftrace
For ad-hoc verification of DNS latency directly on a host node without deploying code, use the following bpftrace command to quickly capture DNS query times.
Conclusion
DNS resolution latency in Kubernetes is a notorious silent failure mode. Standard tools fail to trace UDP packet drops occurring at the kernel Netfilter level. By leveraging eBPF to trace UDP socket operations, we can bridge this visibility gap, detect conntrack confirmation race conditions, and pinpoint the exact source IP, transaction ID, and query domains experiencing timeouts. Combining eBPF observability with targeted fixes like NodeLocal DNSCache and single-request-reopen parameters turns sporadic p99 API timeouts into a predictable, highly performant networking fabric.