Tracing Distributed Transactions Across Async Queue Boundaries with OpenTelemetry Context Propagation
Inject and extract OpenTelemetry trace context across asynchronous message queue boundaries like Kafka and RabbitMQ in Go to prevent trace fragmentation.
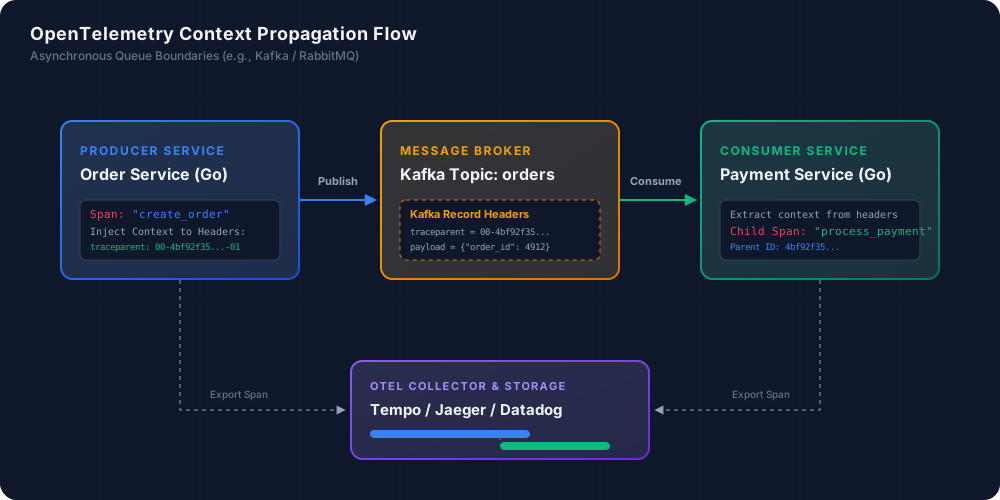
Imagine it is 2:00 AM on a Friday, and your company’s checkout system is throwing transient HTTP 500 errors. You log into Jaeger and find a clean trace showing the checkout request completing in 85ms and publishing a payment.authorize event. However, downstream in the payment service, transactions are failing silently, or worse, customers are being double-charged. When you look up the trace, it ends abruptly at the producer. The payment processor’s spans are completely missing, or they appear as orphaned traces, detached from the original HTTP checkout request. You are forced to manually correlate UUIDs across unstructured cloud logs across three different Kubernetes clusters, wasting hours of critical incident response time. This observability gap exists because standard automated tracing libraries fail at asynchronous queue boundaries. When a message is published to Kafka, RabbitMQ, or AWS SQS, the execution context does not magically cross the network. To maintain a contiguous trace across message queue boundaries, you must explicitly inject, propagate, and extract trace context.
The Black Hole of Async Boundaries: Why Traces Die
In synchronous HTTP or gRPC communication, tracing is relatively straightforward. Interceptors and middlewares automatically inspect incoming network requests, read the standard headers, and bind the trace data to the executing thread or coroutine’s context. This works because the caller is actively blocked waiting for the receiver, keeping the execution flow synchronous and linear.
In asynchronous message queues, the producer and consumer are decoupled in space and time. The producer serializes the payload, appends metadata headers, and pushes it to a broker. The consumer pulls the message seconds, minutes, or even hours later. There is no active call stack or TCP connection linking the two executions. The consumer runs in a different process, often on a separate VM or container, and handles messages in batches.
If the consumer doesn’t extract the metadata from the message headers and create a parent-linked span, the trace trace is severed. The consumer span starts as a new root span, creating orphaned traces. Root spans have no reference to the upstream HTTP checkout request. This means you cannot query “Find the full trace of Order #9421 from the UI request all the way to payment authorization.”
Understanding W3C Trace Context Propagation
To solve this, OpenTelemetry relies on the W3C Trace Context specification. This standard defines two headers that must be propagated across services:
traceparent: Format:00-4bf92f3577b34da6a3ce929d0e0e4736-00f067aa0ba902b7-01- Version (
00): Currently the only defined version. - Trace ID (
4bf92f3577b34da6a3ce929d0e0e4736): 16-byte random ID. Globally unique for the entire transaction. - Parent ID / Span ID (
00f067aa0ba902b7): 8-byte random ID. Represents the span that sent the message. - Trace Flags (
01): 8-bit field. Bit 0 (least significant) denotes if the trace is sampled (01) or not (00).
- Version (
tracestate: Used for vendor-specific routing metadata (e.g.,conkey=val).
In OpenTelemetry, the mapping between the application’s runtime context (e.g., context.Context in Go) and the wire protocol is handled by a TextMapPropagator using a Carrier. A Carrier is an abstraction representing any key-value store, like HTTP headers, metadata maps, or Kafka record headers.
Producer-Side Instrumentation: Injecting Trace Context
To propagate trace context over Apache Kafka, we must implement a custom TextMapCarrier for Kafka headers. In Go, the github.com/IBM/sarama library represents headers as a slice of sarama.RecordHeader structs. We need to implement the propagation.TextMapCarrier interface for this slice so the OpenTelemetry SDK can write the traceparent key-value pair.
With the carrier implemented, we can write our order publisher. The publisher will start a span representing the publication action, inject the context into the Kafka headers, and publish the message.
Consumer-Side Instrumentation: Extracting Trace Context
On the consumer side, the worker processes incoming messages of type *sarama.ConsumerMessage. Because Sarama represents headers differently on the consumer side (as a slice of pointers: []*sarama.RecordHeader), we need a slightly modified carrier implementation.
Now we can implement the consumer execution block. The consumer will read the incoming message headers, extract the trace context, and start a consumer span. This new span will be a child of the span that produced the message, linking the traces across the Kafka boundary.
Adapting to Other Message Brokers: RabbitMQ Integration
This pattern is not limited to Kafka. The same principles apply to RabbitMQ. In RabbitMQ, message headers are stored in a map of type amqp.Table (map[string]interface{}). We can implement a carrier for amqp.Table to handle context propagation across RabbitMQ.
Configuration: Sampling and Performance at Scale
In a high-throughput microservices environment (e.g., handling 10,000+ messages per second), tracing 100% of executions will quickly overwhelm your collector backend and inflate storage costs. To mitigate this, OpenTelemetry uses sampling.
The ideal configuration for asynchronous messaging systems is Parent-Based Sampling. If the upstream producer decides to sample a request (e.g., 1% of checkout requests), the message consumer should respect that decision. This prevents orphaned trace fragments and ensures you only store full, end-to-end execution paths.
Tracing Semantics: Child Spans vs. Span Links
When tracing asynchronous transaction boundaries, you will face an architectural decision: should the consumer’s execution span be a direct child of the producer’s span, or should it be a span link?
Option A: Child Spans (Direct Parenting)
This is the approach shown in snippet-4. The consumer span explicitly references the producer’s span as its parent.
- Pros: In trace visualization tools like Jaeger, Tempo, or Datadog, the entire distributed transaction is rendered as a single, contiguous flame graph. It is easy to follow the sequential execution flow.
- Cons: If the message queue experiences lag (e.g., a message sits in Kafka for 15 minutes before being consumed), the parent span’s total duration will appear to be 15 minutes. This skews your system latency metrics, making fast services look slow.
Option B: Span Links (Asynchronous Links)
Instead of starting a child span, the consumer starts a new root trace and attaches a Link pointing to the producer’s span context.
- Pros: Accurately represents the decoupled lifecycles of async systems. The consumer’s duration reflects only active processing time, not queue wait time.
- Cons: Trace visualization support for links is inconsistent. Navigating across traces requires manual clicking, and tracing the full flow is less intuitive.
Production Recommendation
Use Child Spans if the message queue is used as an RPC mechanism or a fast direct pipeline where processing is expected to happen immediately (sub-second lag). Use Span Links if you are processing batch jobs, background tasks, or long-lived orchestrations where queue lag is expected and common.
Production Failure Modes and Mitigation Strategies
When implementing context propagation in production, watch out for these common engineering pitfalls:
- Header Type Corruption: Kafka headers expect raw bytes (
[]byte). Converting structs or using incorrect string serialization will corrupt thetraceparentpayload. Ensure values are written as plain ASCII/UTF-8 strings converted to byte slices. - Context Bleed in Worker Pools: If you reuse Go routines in worker pools to process messages, do not reuse the parent context. Always extract context afresh from each message using
context.Background(). Reusing context will cause trace contexts to bleed across unrelated messages, resulting in corrupt, overlapping traces. - Trace Loss in Dead-Letter Queues (DLQ): When a consumer fails to process a message and routes it to a DLQ, the broker may strip or replace the headers. Your DLQ publisher must explicitly copy the OpenTelemetry headers from the failed message to the new DLQ payload. Without this, troubleshooting DLQ processing failures will be impossible.
- OTel Collector Bottlenecks: Burst traffic through message queues can overwhelm the local OpenTelemetry Collector. Configure the collector’s
memory_limiterprocessor and tune thebatchprocessor’s queue size to prevent collector OOM (Out Of Memory) crashes during traffic spikes. Use tail-based sampling to discard 100% of successful events and retain traces that throw exceptions or record errors.