Tracing CPU Cache Misses and TLB Thrashing in High-Throughput Java Applications using eBPF and perf_events
Diagnose silent JVM performance degradation caused by CPU cache misses and TLB thrashing using Linux perf_events and low-overhead eBPF programs.
A high-throughput payment processing engine running on a 64-core JVM instance is experiencing tail latency spikes (99.9th percentile > 250ms) under a load of 40,000 requests per second. The typical suspects—garbage collection pauses, database lock contention, and thread pool exhaustion—are completely absent. CPU utilization hovers around 85%, yet overall throughput drops and execution stalls. This is the classic signature of microarchitectural inefficiencies: L1/L3 cache line bouncing and Translation Lookaside Buffer (TLB) thrashing. In high-density cloud environments, the JVM’s deep object hierarchies and pointer-chasing garbage-collected heap degrade Instructions Per Cycle (IPC) from a healthy 2.0 down to a dismal 0.4. Standard Application Performance Monitoring (APM) tools are blind to these hardware-level bottlenecks because they rely on JVM runtime statistics. To diagnose these issues, you must bypass the JVM abstraction layer, query the CPU’s Performance Monitoring Unit (PMU) via Linux perf_events, and leverage custom eBPF programs to map hardware cache stalls directly to offending Java methods.
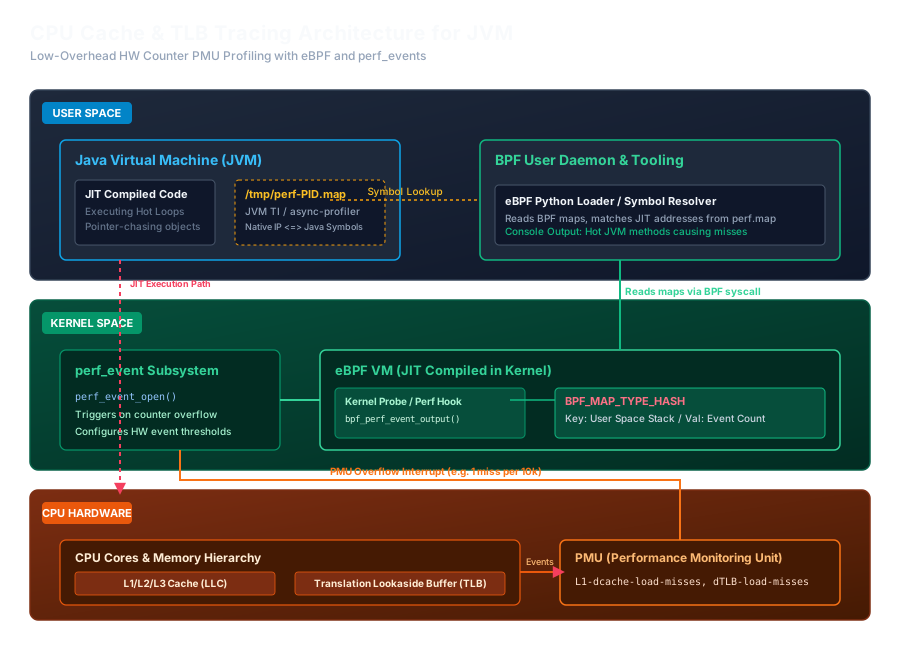
The Hardware Reality: Cache Lines and TLB Walks in the JVM
Modern processors operate at frequencies where accessing main memory (DRAM) is a massive latency bottleneck. While a CPU register access takes less than a nanosecond, fetching data from DRAM takes roughly 50 to 100 nanoseconds—equivalent to 200–300 clock cycles where the execution pipeline sits idle. To hide this latency, CPUs use hierarchical caches (L1 Data, L2, and L3/Last Level Cache). Data is pulled into these caches in chunks of 64 bytes called cache lines.
The JVM heap architecture is fundamentally hostile to this caching design. When you instantiate objects, they are initially allocated sequentially in Thread Local Allocation Buffers (TLABs), which provides excellent spatial locality. However, as garbage collection (GC) cycles run, object allocation positions shift. Objects are moved, promoted, and scattered across the heap. If a hot loop traverses a standard java.util.LinkedList or a deeply nested object graph, the CPU must fetch pointers at each node. Because these nodes are no longer contiguous in memory, the hardware cannot leverage its built-in stream prefetchers. The CPU stalls, discarding its pipeline and waiting for memory fetches.
A compounding issue is the Translation Lookaside Buffer (TLB), a small, ultra-fast hardware cache that stores translations from virtual memory addresses to physical RAM page addresses. By default, Linux operating systems allocate memory in 4KB pages. A 32GB JVM heap contains over 8 million pages. As thread schedulers switch execution contexts across threads, and as those threads traverse massive heaps, the TLB misses frequently. When a TLB miss occurs, the CPU must perform a page table walk. It queries the kernel page table hierarchy (PGD, P4D, PUD, PMD, PTE) to resolve the physical address. A single page walk can require up to five sequential memory accesses, completely stalling execution.
To eliminate cache misses and TLB walks in performance-critical paths, you must alter your data layouts. Instead of allocating graphs of pointer-rich Java objects, you can lay out your data structures in flat, contiguous native memory segments. By using Java’s modern java.lang.foreign API (Foreign Function & Memory API), you can enforce memory alignment and contiguous structures that match the physical cache architecture of the processor.
Bridging the JIT Symbol Gap
To profile cache and TLB misses, we must hook into the CPU’s hardware performance counters. However, the operating system kernel is unaware of JVM internal methods. The HotSpot Just-In-Time (JIT) compiler (C2) dynamically translates Java bytecode into native machine code at runtime and stores it in the CodeCache. Because these memory allocations are dynamic, the OS kernel’s ELF symbol table contains no references to Java class names or method signatures. Standard profiling tools like Linux perf will output raw memory addresses (e.g., [0x00007f8b901a3cd4]) instead of human-readable symbols.
To map these native instructions back to Java code, you must bridge the symbol gap using a /tmp/perf-PID.map file. This map file is a text-based lookup table containing the start address, length, and corresponding Java method name of every JIT-compiled compilation block. The standard tool for generating this map is async-profiler, which hooks into JVM TI (JVM Tool Interface) compilation events.
Furthermore, standard kernel stack-walking depends on frame pointers. By default, the HotSpot compiler optimizes x86 registration by omitting the frame pointer, repurposing the RBP register as a general-purpose register. This breaks the stack-walking utilities of eBPF and perf, resulting in truncated or completely corrupted stack traces. You must execute the JVM with the flag -XX:+PreserveFramePointer to allow the kernel to reliably walk the Java call stack.
System-Wide Hardware Diagnostics with Linux perf
After running the baseline performance checks, evaluate the console output of perf stat using the following target microarchitectural metrics:
- Instructions Per Cycle (IPC): Calculated as
instructions / cycles. An optimized, compute-bound service should hit an IPC of 1.5 to 2.0+. If your IPC is below 0.8, your CPU cores are heavily stalled waiting for memory operations. - L1 Data Cache Miss Rate: Look for the ratio of
L1-dcache-load-misses / L1-dcache-loads. A miss rate exceeding 5% indicates suboptimal spatial data locality in your application’s hot loops. - Last Level Cache (LLC) Miss Rate: Calculated as
LLC-load-misses / LLC-loads. LLC (L3) misses are critical. Since an LLC miss triggers a DRAM fetch, it induces a huge hardware latency penalty. If this exceeds 1%, the system is thrashing its cache lines. - TLB Miss Rate: The ratio of
dTLB-load-misses / dTLB-loads. If the TLB miss rate is above 0.5%, your memory layout is too fragmented, and the system is spending significant CPU cycles walking the page tables.
To correlate these hardware counter metrics with specific application execution paths, you can deploy a lightweight bpftrace profiling script. This attaches to the CPU’s hardware performance events (PMU) and aggregates the active user-space stack traces when counters overflow.
The underlying BCC instrumentation libraries in bpftrace automatically scan /tmp/perf-PID.map based on the targeted process ID. As a result, the output prints fully resolved JIT method signatures alongside standard C-runtime kernel entry points.
Building a Low-Overhead eBPF Profiler for PMU Counters
While bpftrace is excellent for diagnostic exploration, running script interpreters in production environments is often discouraged due to limited control over map management and event filtering overhead. A compiled, custom eBPF program utilizing libbpf minimizes runtime overhead (typically <0.5% CPU) and provides a secure, lightweight monitoring mechanism.
The kernel-space eBPF program attaches to a performance event ring buffer via perf_event_open. It filters events by checking the PID of the current execution thread against a global configuration parameter, target_pid. If the event matches, it registers the current call stack in a native BPF stack trace map and increments a frequency counter.
The user-space orchestrator is written in Python using BCC. The script compiles the BPF source, binds it to a specified PMU counter (such as Last Level Cache misses or TLB misses), and periodically fetches the in-kernel accumulated counters. It resolves dynamic memory addresses using the /tmp/perf-PID.map mappings generated earlier.
Remediation Strategies: Layouts, Huge Pages, and Hardware Alignment
Once you isolate the code paths causing cache and TLB misses, apply these production adjustments to resolve the bottlenecks:
1. Optimize Data Structures for Spatial Locality
If the BPF reports show hot methods traversing deep standard collections (like java.util.HashMap or nested tree layouts), switch to flat, primitive-backed arrays. Use library implementations like fastutil or Agrona direct byte buffers to pack data. Contiguous primitives enable the hardware prefetcher to fetch lines before the execution unit requests them.
2. Configure OS Page Size (TLB walk mitigation)
To decrease TLB misses, configure Linux to allocate Transparent Huge Pages (THP). This scales page allocations from 4KB to 2MB. A 32GB JVM heap then requires only 16,384 TLB entries instead of over 8 million, drastically increasing the TLB hit rate. For maximum consistency, use pre-allocated static Huge Pages. This ensures contiguous physical memory is dedicated exclusively to the JVM process and prevents runtime kernel compaction overhead.
3. Apply Hardware-Aware JVM Arguments
-XX:+UseLargePagesand-XX:+UseTransparentHugePages: Commands the JVM to locate Heap, CodeCache, and internal structures on huge page boundaries.-XX:+UseNUMA: Configures thread allocation policies to be node-local. This binds memory allocations to the NUMA node (socket) hosting the thread, avoiding remote-socket memory access overhead and cross-socket cache coherence bouncing.-XX:ObjectAlignmentInBytes=16: Aligns objects to 16-byte boundaries instead of the default 8-byte boundary. While this increases memory consumption slightly, it aligns allocation chunk starts with cache lines and allows the JVM to address larger heaps with compressed references.-XX:+AlwaysPreTouch: Writes zeros to all allocated virtual heap pages during JVM initialization. This forces the OS to map physical pages and populate the kernel page tables at startup, shifting page allocation overhead away from runtime transaction paths.
Summary
In high-throughput, low-latency Java applications, microarchitectural performance problems like L1/L3 cache misses and TLB walks remain invisible to traditional APM and JVM monitoring tools. By leveraging the CPU’s Performance Monitoring Unit (PMU) using Linux perf_events and running custom eBPF stack collection scripts mapped against /tmp/perf-PID.map JIT symbol tables, you can directly attribute hardware-level bottlenecks to specific Java methods. remediating these bottlenecks via flat memory layouts (such as off-heap memory segments), OS Huge Pages configuration, and NUMA-aware allocation parameters ensures your code runs efficiently at the hardware layer, stabilizing throughput and eliminating microarchitectural tail latencies.