Implementing Tail-Based Sampling in OpenTelemetry Collectors for Cost-Effective Distributed Tracing
A production-hardened guide to implementing tail-based sampling in OpenTelemetry Collectors to reduce storage costs while preserving critical trace anomalies.
A massive traffic spike or a sudden network partition does not just degrade application latency—it floods your telemetry database with millions of redundant successful HTTP 200 traces, driving storage bills to sky-high premiums while burying crucial diagnostics under a mountain of noise. Exporting 100% of traces at 50,000 requests per second with an average span payload of 5KB creates an overwhelming 250MB/s telemetry pipeline. In commercial observability platforms like Datadog or Grafana Cloud, this ingestion rate easily pushes monthly costs past $40,000, while self-hosted Grafana Tempo or ClickHouse clusters buckle under the write-heavy load. The standard fix—head-based probabilistic sampling—is a blind instrument: it drops latency anomalies and rare error traces at the exact same rate as successful database queries. To retain critical diagnostic visibility while keeping costs under control, production platforms must adopt tail-based sampling. By buffering trace spans in memory and evaluating keep/drop decisions only after a trace completes, you can guarantee the collection of 100% of system errors and P99 latency spikes, while compressing normal traffic to a modest 1% baseline.
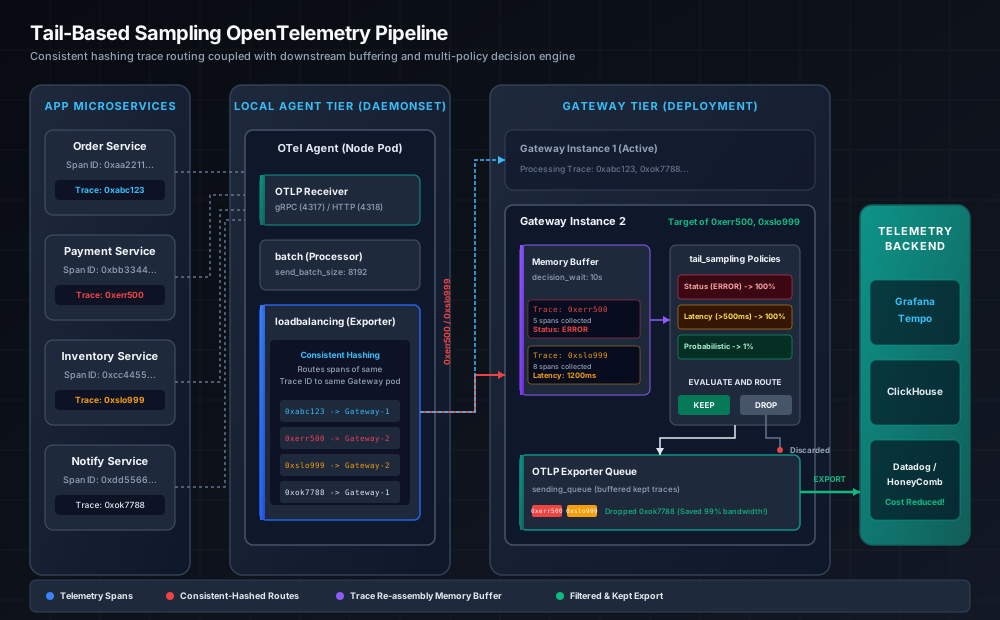
The Mechanics of Tail-Based Sampling: The Stateful Routing Challenge
Unlike head-based sampling, which determines a trace’s fate at its inception point (for example, by having a gateway service set a trace header), tail-based sampling evaluates the entire trace structure before making a decision. This allows policies to analyze attributes like span status (e.g. StatusCode == ERROR), total trace duration, or specific trace attributes collected deep in the microservice call tree.
However, tail-based sampling is stateful. Spans from a single distributed trace are emitted asynchronously by multiple services and can arrive at different OpenTelemetry Collector instances in a load-balanced cluster. If Collector Pod A holds the checkout service span and Collector Pod B holds the database query span, neither pod can reconstruct the full trace history to evaluate a latency or error policy.
To solve this stateful assembly problem, you must configure a two-tier collector architecture:
- Local Agents (DaemonSet): Running on each Kubernetes node, acting as a lightweight local proxy.
- Central Gateways (Deployment): Running the stateful
tail_samplingprocessor.
The Ingress Agents use a consistent-hashing load-balancing exporter to route all spans sharing the same trace_id to the same central Gateway pod. This ensures that a single Collector Gateway instance receives all spans for a given trace, allowing it to reconstruct the trace in RAM, wait for it to complete, and apply sampling policies.
In this agent configuration:
- The
loadbalancingexporter parses thetrace_idof each span and routes it to one of the resolved backend IPs. - The
dnsresolver queries the Kubernetes DNS headless serviceotel-gateway-headlessevery 5 seconds to discover active Gateway pods. - Consistent hashing guarantees that even during a Gateway scale-out event, the vast majority of existing trace IDs continue mapping to their original target nodes, minimizing orphaned spans.
Configuring the Gateway for Stateful Sampling Policies
The central Gateway collectors assemble spans in memory and evaluate them against configured rules. The configuration must define a decision_wait time—the duration the collector waits after receiving the first span of a trace before making a sampling decision. This wait time must accommodate network latency, execution time across downstream microservices, and asynchronous batching delays.
Policies are evaluated sequentially. As soon as a trace matches one of the policies, the “keep” or “drop” decision is executed. Under this production policy set:
- The
drop-health-checksrule usesinvert_match: trueto match spans that do not access health check routes, filtering out common noise. - The
keep-errorspolicy retains 100% of failed traces. - The
keep-latency-spikespolicy retains all traces where duration exceeds 750ms. - A baseline probabilistic policy keeps 1% of normal traces, providing structural telemetry to model system baselines.
The num_traces parameter defines the size of the collector’s internal ring buffer for tracking trace state. If this buffer fills up before decision_wait completes, the collector is forced to drop traces prematurely, leading to lost diagnostic data.
Calculating Buffer Sizing and Memory Requirements
Stateful trace re-assembly occurs in the heap. If your application processes 10,000 requests per second and each request generates a trace consisting of 8 spans, the collector must track 80,000 spans per second. If decision_wait is set to 10 seconds, the collector must buffer 800,000 spans at any point in time.
To calculate the memory required for the stateful buffering tier, use this production sizing formula:
\[\text{Memory}_{\text{buffer}} = R_{\text{trace}} \times S_{\text{span}} \times N_{\text{spans}} \times W_{\text{wait}} \times \text{Overhead}\]Where:
- $R_{\text{trace}}$ = Peak trace arrival rate per second (e.g.
5,000traces/sec) - $S_{\text{span}}$ = Average serialized size of a span (typically
2KBto6KBdepending on custom span attributes, stack traces, and request payloads) - $N_{\text{spans}}$ = Average number of spans per trace (e.g.
6spans) - $W_{\text{wait}}$ =
decision_waitduration (e.g.10s) - $\text{Overhead}$ = Go runtime memory allocation overhead multiplier (usually
2.5xdue to hash maps, string copies, and GC heap headroom)
For our example:
\[\text{Memory}_{\text{buffer}} = 5,000 \times 4\text{KB} \times 6 \times 10 \times 2.5 \approx 3\text{GB}\]This calculation shows that memory consumption scales linearly with the decision_wait time and traffic spikes. If Go runs out of memory, it crashes the collector pod, disrupting the pipeline and causing tracing client buffers on your microservices to fill up. To prevent this, you must pair your configuration with the memory_limiter processor and the environment variable GOMEMLIMIT.
To configure these correctly, you must align the memory limits of the container, the Go runtime (GOMEMLIMIT), and the memory_limiter processor settings. Use the following formula for production deployments:
- Container Memory Limit: Set to the maximum memory allowed for the pod (e.g.,
4GiB). - Go Memory Limit (
GOMEMLIMIT): Set to 90% of the container limit (e.g.,3.6GiBor3600MiB). This leaves a 10% headroom for runtime overhead, stack memory, and CGo memory. - Processor
limit_percentage: Set to 85%. This ensures the collector starts shedding load (dropping incoming spans) before Go reachesGOMEMLIMITand aggressively thrashes the CPU in continuous GC cycles. - Processor
spike_limit_percentage: Set to 10% to prevent sudden traffic spikes from bypassing the limiter limit before a check interval occurs.
Managing Backpressure and Exporter Queues under Load
When downstream telemetry systems (e.g. a Grafana Tempo distributor or an in-house ClickHouse cluster) experience write lag, the collector gateway must buffer the kept traces in memory. If the exporter’s sending queue overflows, the collector will propagate backpressure upstream. If the queues are not bounded or configured incorrectly, memory usage spikes, triggering the memory_limiter and leading to dropped traces.
In this configuration:
queue_sizedefines the number of batches buffered in memory when downstream connections fail. If set to15000, and each batch contains512spans, we buffer up to7.6 millionspans.num_consumersdictates how many concurrent gRPC streams send data to Tempo. If your backend suffers from high latency, you must increase this value (e.g., from4to16or32) to maintain throughput.max_elapsed_timesets a maximum threshold of5mfor retrying. Spans older than 5 minutes are discarded to prevent heap exhaustion.
Composite Sampling Policies for Complex Workloads
In a complex microservices mesh, you often need different sampling behavior based on service characteristics. For instance, payment transactions must be sampled at a higher baseline than catalog browsing requests. The composite policy allows you to combine multiple sub-policies with logical operators (AND/OR).
Under this configuration:
- A trace is evaluated against
keep-all-errorsfirst. If it contains an error, it is immediately kept. - If not, and the trace originated in
checkout-service, the composite policy evaluates the probabilistic rule, keeping10%of checkout traffic. - Traces from other services fall through to the
general-probabilisticpolicy, keeping1%of normal transactions.
Application SDK Configurations to Prevent Thread Blocking
A common production failure occurs when application client buffers fill up because the local collector agent is down or rejecting spans. If the application OTel SDK is configured with a blocking span processor, HTTP worker threads will block waiting to export telemetry, causing application response times to degrade dramatically.
In this Go SDK configuration:
WithMaxQueueSize(2048)ensures that the application’s SDK will hold a maximum of 2,048 spans in memory. When this buffer fills (e.g. the node agent fails), new spans are dropped rather than exhausting application memory or blocking worker threads.WithBatchTimeoutforces trace flush every 500ms, preventing spans from accumulating in client memory and keeping trace latency low.
Monitoring Tail-Sampling Health (Prometheus Metrics)
Operationalizing a tail-sampling pipeline requires monitoring collector-level health metrics. If the consistent-hashing exporter on the agents starts failing, or if the gateway buffer fills up, you need alerts to flag these anomalies before traces are lost.
| Metric Name | Type | Description | Warning Threshold / Alert Condition |
|---|---|---|---|
otelcol_processor_tail_sampling_count_traces_sampled |
Counter | Total traces evaluated by the processor. | Alert if drops to 0 (pipeline stalled). |
otelcol_processor_tail_sampling_new_trace_decisions |
Counter | Number of new trace IDs registered in the buffer. | Compare with incoming trace rate to detect orphan spans. |
otelcol_processor_dropped_spans |
Counter | Spans dropped due to memory limiter actions. | Critical alert if value > 0 (node shedding load due to memory pressure). |
otelcol_receiver_refused_spans |
Counter | Spans rejected at the receiver tier due to backpressure. | Warning alert (signals upstream blocking or network congestion). |
SRE Operational Troubleshooting Guide
Symptom: Incomplete Traces (Orphaned Spans)
- Root Cause: Spans of the same trace ID are routing to different gateway instances. This occurs when the
loadbalancingresolver DNS lookup cache is stale or when application pods are communicating directly with different gateways bypassing node agents. - Resolution: Verify application containers connect only to their local daemonset agent on
localhost:4317. Ensure the agent configuration’sloadbalancingresolver references the gateway headless service and has an update interval of5sor less.
Symptom: High CPU thrashing on Gateway pods
- Root Cause: Memory usage is near
GOMEMLIMITbut slightly belowmemory_limiterlimit, forcing Go’s GC to run continuously (GC thrashing). - Resolution: Reduce the
memory_limiter.limit_percentageto80%or increase the pod memory limit in Kubernetes.
Symptom: Missing trace context across Kafka or async queues
- Root Cause: Trace context propagation headers (
traceparent) are not being injected/extracted across async boundary limits. - Resolution: Enforce context propagation in headers.
Conclusion and Migration Path
Implementing tail-based sampling in OpenTelemetry Collectors is one of the most effective strategies for scaling a distributed tracing infrastructure cost-effectively. By adopting a two-tier collector topology with consistent trace routing, configuring memory protection rules, and sizing your memory buffers accurately, you can reduce backend tracing costs by up to 90% while retaining critical diagnostics for error tracking and latency analysis.