Real-Time Memory Leak Detection in Production Node.js Services Using V8 Heap Snapshots and Core Dumps
Stop silent cgroups OOM-kills at 3 AM. Build an automated real-time memory leak detection, safe snapshotting, and core dump analysis pipeline in Node.js.
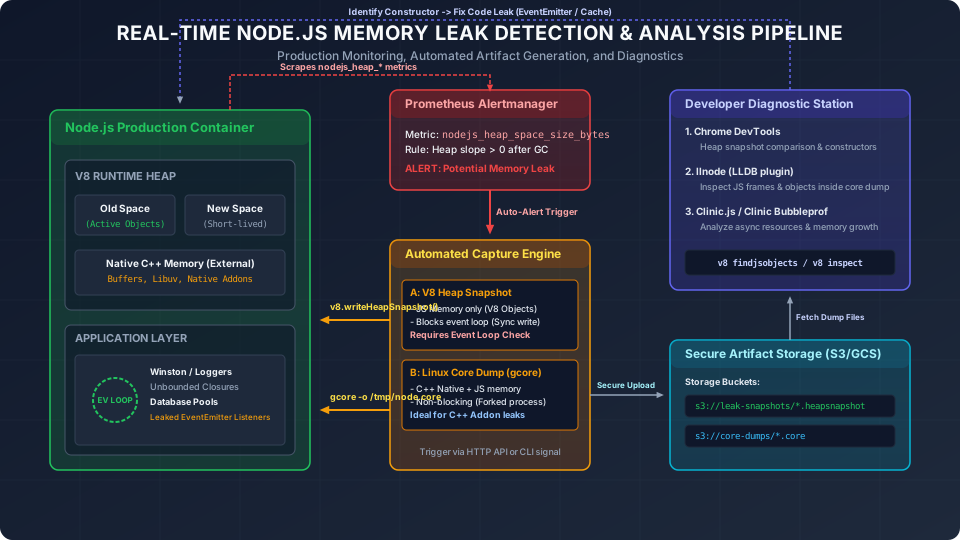
It is 3:00 AM, and your pager goes off. A core API microservice running in your Kubernetes cluster has been restarted due to an Out Of Memory (OOM) kill. The Prometheus dashboard displays a classic sawtooth pattern: memory utilization climbs monotonically over twelve hours, hits the 2GB cgroups limit, and abruptly drops to zero as the container runtime terminates the process. Standard APM metrics tell you when it died, but they do not tell you why. Inspecting the logs yields no error traces because the kernel killed the process before Node.js could emit an uncaught exception or clean up. Standard troubleshooting methods, such as profiling locally under synthetic load, fail to replicate the leak because it is triggered by unique traffic patterns, connection churn, or slow database responses specific to the production environment. To resolve these issues permanently, you must capture diagnostic telemetry directly from your running production containers without causing service outages or long latencies.
The Trap of Kubernetes Container Limits vs. V8 Heap
In containerized deployments, engineers often assume that setting the --max-old-space-size flag to match the Kubernetes memory limit is sufficient to prevent OOM events. This is a critical misconception. Node.js memory allocation is split into two primary segments: the V8 Managed Heap and Native C++ Memory (External).
The V8 Heap contains all JavaScript objects, closures, contexts, and variables. It is managed by V8’s Garbage Collector (GC) and divided into distinct logical spaces:
- New Space (semi-spaces): A small, highly active region where new objects are allocated. Garbage collection here is fast, managed by the Scavenger algorithm.
- Old Pointer Space: Contains survived objects that hold references to other objects.
- Old Data Space: Contains raw data (strings, numbers, boxed arrays) without pointers to other objects.
- Large Object Space: Bypasses normal GC allocation and compaction to prevent performance bottlenecks.
- Map Space (and Code Space): Contains compiled machine code (JIT) and V8’s internal object shapes (Maps).
Conversely, Native C++ Memory operates outside the V8 heap. This includes Libuv thread pools, active network sockets, database connections, Node.js Buffers, compression contexts (Zlib), and compiled native addons (such as sharp or bcrypt).
+-------------------------------------------------------------------+
|                     Kubernetes Container RSS                      |
|                                                                   |
|  +--------------------------------+  +--------------------------+  |
|  |           V8 Heap              |  |    Native C++ Memory     |  |
|  |  +------------+  +----------+  |  |  (Off-Heap / External)   |  |
|  |  | New Space  |  |Old Space |  |  |                          |  |
|  |  +------------+  +----------+  |  |  +------------+  +----+  |  |
|  |  | Large Obj  |  |Code/Maps |  |  |  | Libuv/Socks|  |Buff|  |  |
|  |  +------------+  +----------+  |  |  +------------+  +----+  |  |
|  +--------------------------------+  +--------------------------+  |
+-------------------------------------------------------------------+
If you set --max-old-space-size=2048 on a container restricted to 2GiB of memory, the container will be OOM-killed long before V8 reaches its heap limit. When Node.js allocates Buffers (which are backed by native memory outside the V8 heap heap limit but tracked via external memory size), or when the process encounters high concurrency that inflates socket count, the actual Resident Set Size (RSS) will easily breach the 2GB threshold. When RSS hits the cgroup limit, the Linux kernel triggers the OOM killer, sending a SIGKILL (Exit Code 137). The Node.js runtime has no opportunity to handle this signal, write crash reports, or flush buffers.
Furthermore, pointer compression (introduced in Node.js 14 and V8 8.0) compresses internal pointers to 32-bit offsets within a 4GB virtual cage. While this reduces memory footprint by up to 40%, it hides the actual native memory overhead of the V8 isolate. Consequently, you must monitor both V8 Heap metrics and RSS metrics, and trigger diagnostics well before hitting cgroups limits.
Automated Anomaly Detection & Triggering
Relying on manual human intervention to capture memory diagnostics is unreliable. If a leak is fast, the container dies before an engineer can run a debugger. If the leak is slow, manual capture is prone to timing errors. Instead, we implement programmatic anomaly detection directly inside the Node.js runtime.
Prometheus metrics scraped via a library like prom-client expose heap details, but to react immediately, the service itself must monitor its own performance metrics. The following snippet implements an in-memory diagnostic monitor. It hooks into the garbage collection lifecycle using V8’s perf_hooks and calculates the linear trend of heap usage post-Garbage Collection.
Using post-GC metrics is essential: tracking memory without accounting for GC sweeps leads to false positives, as memory usage naturally climbs between GC runs.
Safe Generation of Heap Snapshots in Production
Generating a heap snapshot is a synchronous operation. V8 must pause execution, traverse the entire object graph, serialize every pointer reference, and write the payload to disk. For a service utilizing 1.5GB of heap, this process can block the event loop for 5 to 15 seconds depending on CPU and disk performance. During this time:
- Inbound HTTP/gRPC requests stall and time out.
- Kubernetes liveness/readiness probes fail, prompting the cluster controller to terminate the container.
- Upstream load balancers remove the container from rotation, or retry requests, exacerbating network bottlenecks.
To execute this safely in production, you must decouple the generation phase from live traffic. The optimal approach involves modifying the instance readiness probe to temporarily drain traffic, waiting for active connections to clear, and then executing the snapshot.
Non-Blocking Diagnostics: Linux Core Dumps with gcore
When even temporary traffic draining is not feasible, or when the memory leak resides outside the V8 heap inside the C++ runtime (which standard heap snapshots cannot inspect), you must generate a Linux core dump.
A core dump records the exact state of physical memory assigned to the process. Rather than serializing memory, the operating system can write this raw dump rapidly. To minimize interruption, we use the gcore utility (part of gdb). gcore forks the process, stops the parent temporarily while cloning the memory pages using Copy-on-Write (CoW), and streams the child memory to a file in the background. The actual process interruption is usually under 100 milliseconds.
# // snippet-3
#!/usr/bin/env bash
# script to dump process memory without killing the process
set -euo pipefail

TARGET_PID=$(pgrep -x "node" | head -n 1)
OUTPUT_DIR="/opt/diagnostics/dumps"
OUTPUT_FILE="${OUTPUT_DIR}/node_pid_${TARGET_PID}_$(date +%s).core"

mkdir -p "$OUTPUT_DIR"

echo "[SHERLOCK] Initiating non-blocking core dump for PID ${TARGET_PID}..."
START_TIME=$(date +%s%N)

# Trigger gcore to execute memory clone
gcore -o "$OUTPUT_FILE" "$TARGET_PID" > /dev/null 2>&1

END_TIME=$(date +%s%N)
DURATION_MS=$(( (END_TIME - START_TIME) / 1000000 ))

echo "[SHERLOCK] Core dump successfully created at ${OUTPUT_FILE}."
echo "[SHERLOCK] Process blocked for approximately ${DURATION_MS}ms."

# Verify if we should push this to cloud storage
if [[ -n "${S3_DIAGNOSTIC_BUCKET:-}" ]]; then
  echo "[SHERLOCK] Archiving core dump to S3..."
  aws s3 cp "$OUTPUT_FILE" "s3://${S3_DIAGNOSTIC_BUCKET}/core-dumps/"
  rm -f "$OUTPUT_FILE"
fi
To execute gcore within a Docker container, the container must run with specific Linux capabilities. By default, Docker containers restrict access to ptrace system calls, which prevent gdb/gcore from attaching to the process. You must grant the container CAP_SYS_PTRACE privilege in your Kubernetes deployment configuration, and define a persistent read-write volume for core dumps.
# // snippet-4
apiVersion: apps/v1
kind: Deployment
metadata:
  name: billing-service
  namespace: production
spec:
  replicas: 3
  template:
    spec:
      containers:
      - name: billing-app
        image: node:20-slim
        resources:
          limits:
            memory: 2Gi
            cpu: 1000m
        securityContext:
          capabilities:
            add:
            - SYS_PTRACE
        volumeMounts:
        - name: core-dumps-dir
          mountPath: /opt/diagnostics/dumps
      volumes:
      - name: core-dumps-dir
        emptyDir: {}
Translating Core Dumps to JS Objects: The llnode Toolchain
A raw core dump contains binary segments, stack frames, and hardware registers, but lacks direct mappings to JavaScript constructs. To bridge this gap, you need a post-mortem tool capable of inspecting the V8 structures embedded inside the node binary. The standard tool for this is llnode, a plugin for the LLDB debugger.
First, ensure you have LLDB and the llnode plugin installed on your inspection machine (never install these in your production container image to keep security risks minimal). To analyze the dump, you must pass the identical Node.js executable that ran in production, along with the captured core file.
# // snippet-5
# Load the core dump into LLDB using the exact Node execution binary
$ lldb /usr/local/bin/node -c /opt/diagnostics/dumps/node_pid_1.core

(lldb) target create "/usr/local/bin/node" --core "/opt/diagnostics/dumps/node_pid_1.core"
Core file '/opt/diagnostics/dumps/node_pid_1.core' (x86_64) was loaded.

# Load the llnode plugin to translate V8 runtime objects
(lldb) plugin load /usr/lib/node_modules/llnode/llnode.so

# List all JS objects on the heap grouped by constructor name
(lldb) v8 findjsobjects
 Instances  JS Class Name
==================================================
     42194  String
     18522  Object
     12803  Array
      8201  Closure
      4912  EventEmitter
      3500  PaymentTransactionDetail
      2118  Map
...

# Find all instances of a specific suspect constructor (e.g. EventEmitter or PaymentTransactionDetail)
(lldb) v8 findinstances PaymentTransactionDetail
0x00002ab45192410a:<JSObject: PaymentTransactionDetail>
0x00002ab4519268ab:<JSObject: PaymentTransactionDetail>
0x00002ab4519280b2:<JSObject: PaymentTransactionDetail>
...

# Inspect a specific instance to read its internal properties and fields
(lldb) v8 inspect 0x00002ab45192410a
0x00002ab45192410a:<JSObject: PaymentTransactionDetail> {
  "id": 0x00001bc49018ca21:<String: "txn_290184918">,
  "metadata": 0x00002ab451924151:<JSObject: Object>,
  "created": 0x00001ac49219c01b:<Number: 1719648000>,
  "cachedCallback": 0x00003cb45290b21a:<JSFunction: (anonymous)>
}
The output of llnode allows you to pinpoint the objects that survive Garbage Collection, identify their constructors, and inspect internal variables such as keys and callback parameters. In the trace above, the existence of 3500 instances of PaymentTransactionDetail, coupled with the anonymous cachedCallback field, strongly suggests that transaction records are being pinned in memory, likely via an unresolved callback or an unbounded cache array.
Analyzing Heap Snapshots with Chrome DevTools
For standard JavaScript memory leaks, analyzing .heapsnapshot files using Chrome DevTools provides a highly visual diagnostic workflow.
The Comparison View (The Golden Rule)
Do not analyze a single heap snapshot in isolation. A single snapshot only shows the distribution of current allocations, which is often dominated by standard framework objects or routing matrices. To find a leak, you need a comparison:
- Deploy the service and wait for it to pass its initialization phase.
- Trigger the first snapshot: Snapshot A (Baseline).
- Apply synthetic load or wait for normal traffic to cycle several thousand requests.
- Trigger the second snapshot: Snapshot B (Comparison).
- Load both files into the Memory tab of Chrome DevTools.
- Select Snapshot B, and change the perspective dropdown from Summary to Comparison, targeting Snapshot A as the baseline.
+---------------------------------------------------------------------------------------+
|  Chrome DevTools Memory Tab                                                           |
|  [ Comparison v ]  Target: [ Snapshot A v ]                                           |
|                                                                                       |
|  Constructor              | # Alloc | # Freed | Size Delta  |  Purged | Size  |       |
|  -------------------------+---------+---------+-------------+---------+-------+       |
|  (closure)                |  12040  |   1200  |  +10840     |         |       |       |
|  EventEmitter             |   4800  |      0  |  +4800      |         |       |       |
|  Map                      |   8290  |   8285  |  +5          |         |       |       |
+---------------------------------------------------------------------------------------+
Sort the grid by the Size Delta or # Delta column. In a healthy application, the delta for most constructors should hover near zero. If you observe thousands of (closure) allocations or EventEmitter instances that were allocated but not freed, you have identified the leak target.
Constructors and Retainers
Understanding DevTools terminology is critical for interpreting the retainers tree:
- Shallow Size: The physical memory allocated to store the object itself (typically under 100 bytes for basic JS structures).
- Retained Size: The total memory freed if the object were destroyed and its references removed from the GC graph. A single root object (like a global cache Map) might have a shallow size of 64 bytes, but a retained size of 500MB if it holds the only references to thousands of nested objects.
When you click on a leaked object in the constructor list, the bottom panel displays the Retainers Tree. This tree lists the chains of references keeping the object alive, pointing back to the GC Roots (like the global window or Node.js process context, or root-level scopes).
Look for the shortest path to a GC root (highlighted in bold text in DevTools). This tells you exactly which parent object, closure context, or global variable is holding onto the reference and preventing the V8 Garbage Collector from reclaiming it.
Common Leaking Anti-Patterns and Refactoring
Most production Node.js memory leaks fall into three major design patterns.
1. The Per-Request Event Listener Leak
Every time an HTTP request flows through your middleware, you register an event handler on a long-lived object (like the global process or a DB connection pool instance). If you fail to detach that handler once the request completes, the connection pool retains a reference to the request context, leaking the entire request scope.
2. Unbounded Memory Caches
Caching database queries or API results in a raw JavaScript Object or Map without size limitations is a common source of leaks. As keys accumulate, the map grows indefinitely.
3. Closure Scope Pollution
Closures retain references to all variables in their parent scopes. If a closure survives long-term (e.g. inside a global handler), any variables declared in its parent scope will also survive, even if the closure never accesses them.
Memory leaks in Node.js production environments require systematic diagnostic pipelines. By establishing automated GC-aware monitoring thresholds, implementing readiness probe drains for safe heap snapshots, capturing core dumps with gcore to bypass event loop blocks, and analyzing the results through llnode and DevTools comparison profiles, you can diagnose and resolve memory regressions before they impact users.