A Quantitative Matrix for Grading Architectural Drift in Large-Scale Microservice Ecosystems
A production-tested, mathematical framework to quantify, grade, and alert on architectural drift in distributed systems before they degrade into distributed monoliths.
Architectural drift in large-scale microservice ecosystems behaves like dark matter: it is invisible during steady-state operations, yet its gravitational pull silently decays system reliability until a minor deployment triggers a catastrophic cascade. We have all experienced the symptoms—a routine billing update unexpectedly brings down the catalog service because a junior engineer bypassed the API gateway to execute direct database reads against an un-indexed MongoDB collection, or a regional Kubernetes failover deadlocks because circular runtime dependencies between five core services prevent them from completing their boot sequence. The root cause is not a lack of talent or code-level testing; it is the absence of a structured, continuous, and quantitative feedback loop. Without a mathematical index to measure how far runtime topology has drifted from the target blueprint, system entropy guarantees that a microservice ecosystem will eventually decay into a highly coupled, brittle, distributed monolith.
The Illusion of the Green Build: Why Static Analysis and Tracing Alone Fail
Standard continuous integration pipelines are designed to validate isolated units of code. A pull request passes linting (e.g., ESLint, Go Linter), compiles successfully, and achieves 85% code coverage. The CI runner flashes green, and the code is deployed. Meanwhile, distributed tracing tools like Jaeger or Datadog record latency, throughput, and error rates, while APM dashboards track CPU utilization and memory leakage.
These tools are crucial for operational visibility, but they suffer from a fundamental blind spot: they measure performance, not conformance.
A service can exhibit single-digit millisecond latency while actively violating the organization’s architectural constraints. For instance:
- A developer might import a client library from another domain directly, coupling the internal data structures of two services.
- An OTel trace might capture a path through the network that bypasses the ingress authentication layer, yet because the target service doesn’t reject it, the system marks the call as successful.
- A service might utilize a deprecated REST payload format instead of the mandated gRPC Protobuf schemas, increasing serialization overhead and breaking type safety.
Traditional static analysis cannot capture runtime dependencies, and runtime tracers lack the context of what the architecture should look like. To bridge this gap, engineering organizations must introduce a unified, quantitative metric: the Architectural Drift Index (ADI).
The Mathematical Framework of the Architectural Drift Index (ADI)
The Architectural Drift Index (ADI) is a composite score calculated daily or per-deployment for every service in the ecosystem. It normalizes distinct architectural dimensions into a single scalar value. A service with an ADI of 0.0 represents absolute compliance with the target architecture, while a score exceeding 5.0 indicates severe degradation.
The ADI of a service $S$ is defined as the weighted sum of four core metrics:
\[ADI(S) = w_{C} \cdot C(S) + w_{S} \cdot S(S) + w_{I} \cdot I(S) + w_{L} \cdot L(S)\]Where:
- $C(S)$ is the Coupling Metric (Weight: $w_{C} = 0.40$).
- $S(S)$ is the Protocol & Schema Compliance Metric (Weight: $w_{S} = 0.30$).
- $I(S)$ is the Infrastructure Bypass Metric (Weight: $w_{I} = 0.20$).
- $L(S)$ is the Lifecycle & Technology Stack Compliance Metric (Weight: $w_{L} = 0.10$).
The weights reflect the operational impact of each violation. Coupling is weighted highest because tight coupling leads to cascading failures, deployment lock-in, and distributed deadlocks—the costliest architectural failure modes.
Pillar 1: The Coupling Metric ($C$)
The Coupling Metric quantifies the degree of logical and data dependency between service boundaries. In a clean microservice architecture, services should share nothing but network APIs, and their runtime call graphs should form a Directed Acyclic Graph (DAG) with bounded fan-out.
We define $C(S)$ as:
\[C(S) = \alpha \cdot D_{db} + \beta \cdot N_{cyclic} + \gamma \cdot \max(0, F_{out} - F_{max})\]Where:
- $D_{db} \in {0, 1}$ (Shared Database Bypass): This binary flag is set to
1if the service directly queries or writes to a database schema owned by another microservice. Direct database sharing is the single most severe architectural violation. We assign a weight of $\alpha = 5.0$. - $N_{cyclic} \in \mathbb{N}_{0}$ (Circular Dependency Count): The number of closed loops in the runtime dependency graph in which service $S$ participates (e.g., $S \rightarrow S_2 \rightarrow S_3 \rightarrow S$). Circular dependencies create tight deployment coupling and make startup order validation impossible during cluster cold boots. We assign $\beta = 3.0$.
- $F_{out} \in \mathbb{N}_{0}$ (Outbound Fan-out): The number of distinct microservices that $S$ invokes synchronously over HTTP/gRPC. High fan-out indicates that a service is acting as a distributed orchestrator with excessive network dependencies.
- **$F_{max} \in \mathbb{N}{0}$ (Max Acceptable Fan-out):** The organization’s agreed limit for outbound service dependencies (recommended default: $F{max} = 6$).
- $\gamma$ (Fan-out Penalty Coefficient): We assign $\gamma = 0.5$ for every outbound link exceeding $F_{max}$.
Real-World Failure Mode: The Shared Database Trap
Consider an Orders Service and a Billing Service. Under pressure to deliver a feature, a developer configures the Billing Service to write directly to the PostgreSQL instance of the Orders Service using a shared connection string.
Six months later, the database administrator alters the column types of the orders table. The Orders Service code is updated and deployed smoothly. However, the Billing Service immediately crashes in production with database driver errors, halting the checkout pipeline.
By capturing direct DB access using tools like database audit logs (e.g., AWS Aurora Database Activity Streams) and mapping them to $D_{db}$, this violation is immediately flagged in the ADI scorecard, preventing the migration from breaking decoupled runtime environments.
Pillar 2: Protocol & Schema Compliance Metric ($S$)
Microservices must communicate through well-defined, typed interfaces. Protocol drift occurs when services bypass standardized protocols (e.g., gRPC, Apache Kafka) in favor of ad-hoc JSON over HTTP, or fail to adhere to schema registries.
We define $S(S)$ as:
\[S(S) = \mu \cdot U_{proto} + \sigma \cdot N_{breaking} + \delta \cdot P_{deprecated}\]Where:
- $U_{proto} \in {0, 1}$ (Unapproved Protocol): Set to
1if the service communicates using non-approved protocols (e.g., raw WebSockets for internal service-to-service communication instead of standard gRPC streaming). Weight $\mu = 3.0$. - $N_{breaking} \in \mathbb{N}_{0}$ (Breaking Changes): The number of backward-incompatible schema changes introduced to the service’s API contracts (GraphQL, OpenAPI, or Protobuf) without a major version path bump. Checked via static registry tooling (e.g., Buf CLI or Confluent Schema Registry). Weight $\sigma = 4.0$.
- $P_{deprecated} \in [0, 1]$ (Deprecated Endpoint Call Ratio): The proportion of outbound requests from $S$ that target endpoints flagged as deprecated in the global service registry. Calculated as:
Where $V_{deprecated}$ is the volume of calls to deprecated endpoints and $V_{total_out}$ is the total outbound call volume. Weight $\delta = 2.0$.
Pillar 3: Infrastructure Bypass Metric ($I$)
Modern infrastructure platforms rely on ingress controllers, API gateways, and service meshes (e.g., Istio, Linkerd) to enforce authentication, authorization, rate limiting, and traffic routing. When services circumvent this infrastructure, they create severe security and reliability gaps.
We define $I(S)$ as:
\[I(S) = \theta \cdot B_{gateway} + \phi \cdot U_{plaintext}\]Where:
- $B_{gateway} \in [0, 1]$ (Gateway Bypass Ratio): The ratio of external client traffic (originating from outside the cluster) that reaches service $S$ directly, bypassing the API Gateway (e.g., Kong, Envoy). This occurs when Kubernetes services are misconfigured as
NodePortorLoadBalancertype instead ofClusterIPbehind an ingress. Calculated as:
Weight $\theta = 5.0$.
- $U_{plaintext} \in {0, 1}$ (Plaintext Service Mesh Bypass): Set to
1if service-to-service calls bypass the mutual TLS (mTLS) proxy sidecar. This indicates that traffic is routed around the service mesh envelope, escaping encryption and policy enforcement. Weight $\phi = 2.5$.
Real-World Failure Mode: Plaintext Bypass in Production
An engineer debugs a gRPC connection issue in staging by temporarily disabling Istio sidecar injection on the Inventory Service deployment and hardcoding the target port to raw HTTP. The application starts working, and the change is merged.
In production, the service is now communicating over plaintext HTTP across the network, violating compliance standards (PCI-DSS/GDPR) and bypassing trace propagation headers. By monitoring mesh network data, the ADI engine instantly registers $U_{plaintext} = 1$, driving the service’s score up and triggering an automated security alert.
Pillar 4: Lifecycle & Technology Stack Compliance Metric ($L$)
Technological heterogeneity is a double-edged sword. While it allows teams to select the optimal language for a domain, unchecked proliferation of frameworks and versions creates maintenance silos, security vulnerabilities, and platform engineering bottlenecks.
We define $L(S)$ as:
\[L(S) = \omega \cdot T_{obsolete} + \psi \cdot D_{stale}\]Where:
- $T_{obsolete} \in {0, 1}$ (Obsolete Tech Stack): Set to
1if the service runs on a runtime or language version designated as End-Of-Life (EOL) or deprecated by the platform engineering team (e.g., Node.js 14 in 2026). Weight $\omega = 4.0$. - $D_{stale} \in \mathbb{R}^{+}$ (Deployment Staleness Score): Quantifies how long the service has run in production without being recompiled and redeployed from the main branch. This captures “zombie” microservices that may compile with obsolete dependencies or contain unpatched CVEs. Calculated as:
Weight $\psi = 1.5$. The logarithmic function prevents the metric from ballooning indefinitely while ensuring that older services continuously decay in grade until they undergo a validation deploy.
Continuous Drift Analysis: The Collection Pipeline Architecture
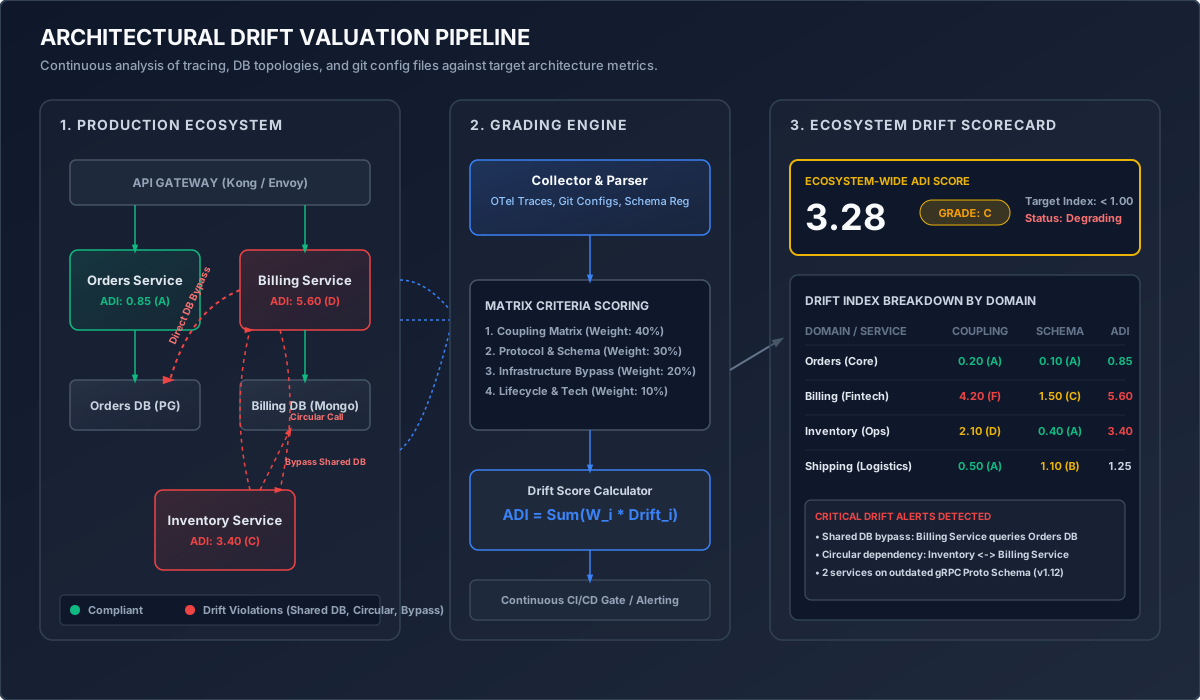
Calculating the ADI requires aggregating metadata from diverse infrastructure layers. The diagram at the beginning of this post outlines the pipeline, which executes in three stages:
1. The Collection Layer
- Distributed Tracing (OpenTelemetry): The OTel Collector processes trace telemetry, extracting the real-time runtime call graph. It logs caller-callee relationships, protocol usage, and trace attributes.
- Kubernetes API & Istio Control Plane: A daemon queries the Kubernetes api-server to inspect service definitions (ensuring no unauthorized external load balancers exist) and queries the Istio service mesh to verify mTLS policies.
- Git Repository Analyzers: Linting engines run AST parsers (e.g., Semgrep) to inspect code imports, scanning for prohibited direct database driver configurations.
- Schema Registries: Schema endpoints are queried to verify schema validation rules and flag unapproved backward-incompatible modifications.
2. The Analysis Daemon
The collected data is ingested by a central daemon. The daemon converts trace graphs into adjacency matrices, detects cycles using Tarjan’s strongly connected components algorithm, and evaluates the ADI metrics for each microservice using the formal equations defined above.
Here is a Python-based implementation of the core evaluation engine:
import numpy as np

class DriftAnalyzer:
    def __init__(self, weights=None):
        # Default weights matching the mathematical framework
        self.w = weights or {
            'coupling': 0.40,
            'schema': 0.30,
            'infra': 0.20,
            'lifecycle': 0.10
        }

    def calculate_coupling_score(self, shared_db: bool, is_in_cycle: bool, fan_out: int, max_fan_out: int = 6) -> float:
        d_db = 5.0 if shared_db else 0.0
        c_cyc = 3.0 if is_in_cycle else 0.0
        f_penalty = 0.5 * max(0, fan_out - max_fan_out)
        return d_db + c_cyc + f_penalty

    def calculate_schema_score(self, unapproved_proto: bool, breaking_changes: int, deprecated_ratio: float) -> float:
        u_proto = 3.0 if unapproved_proto else 0.0
        n_breaking = 4.0 * breaking_changes
        p_deprecated = 2.0 * deprecated_ratio
        return u_proto + n_breaking + p_deprecated

    def calculate_infra_score(self, gateway_bypass_ratio: float, plaintext_bypass: bool) -> float:
        b_gateway = 5.0 * gateway_bypass_ratio
        u_plaintext = 2.5 if plaintext_bypass else 0.0
        return b_gateway + u_plaintext

    def calculate_lifecycle_score(self, obsolete_stack: bool, days_since_deploy: int) -> float:
        t_obsolete = 4.0 if obsolete_stack else 0.0
        d_stale = 1.5 * np.log(max(1, days_since_deploy / 30.0))
        return t_obsolete + d_stale

    def compute_adi(self, metrics: dict) -> float:
        c_score = self.calculate_coupling_score(
            metrics.get('shared_db', False),
            metrics.get('is_in_cycle', False),
            metrics.get('fan_out', 0)
        )
        s_score = self.calculate_schema_score(
            metrics.get('unapproved_proto', False),
            metrics.get('breaking_changes', 0),
            metrics.get('deprecated_ratio', 0.0)
        )
        i_score = self.calculate_infra_score(
            metrics.get('gateway_bypass_ratio', 0.0),
            metrics.get('plaintext_bypass', False)
        )
        l_score = self.calculate_lifecycle_score(
            metrics.get('obsolete_stack', False),
            metrics.get('days_since_deploy', 0)
        )

        adi = (self.w['coupling'] * c_score +
               self.w['schema'] * s_score +
               self.w['infra'] * i_score +
               self.w['lifecycle'] * l_score)
        return round(adi, 2)
From Index to Grade: Establishing the Architectural Drift Matrix
The raw ADI is mapped to a standardized grading system, which governs the release pipelines in the CI/CD environment.
| Grade | ADI Score Range | Systemic Risk Profile | Release Pipeline Action | Required Remediation |
|---|---|---|---|---|
| Grade A | $0.0 \le ADI < 1.0$ | Low: Perfect alignment with architectural blueprint. | Auto-approved. | None. Standard lifecycle operations. |
| Grade B | $1.0 \le ADI < 2.5$ | Moderate: Minor architectural deviations. | Release warning logged in PR. | Ticket auto-created in JIRA; resolve within two sprint cycles. |
| Grade C | $2.5 \le ADI < 4.5$ | Elevated: Technical debt accumulating. Systemic brittle behavior possible. | Mandatory Tech Lead sign-off. | Action plan scheduled for remediation. Blocked from major releases. |
| Grade D | $4.5 \le ADI < 7.0$ | High: Severe drift. High risk of cascading failures. | Deployment blocked in Production (allowed only in Staging). | Escalated to Engineering Director. Refactoring mandatory before deployment. |
| Grade F | $ADI \ge 7.0$ | Critical: Catastrophic failure risk. Active security/availability compromise. | Automated CI/CD gate block across all environments. | Immediate emergency intervention. Hard block on all branch merges. |
Implementing this matrix establishes a clear contract: architectural compliance is as important as code correctness. If a developer attempts to merge code that pushes a service into Grade D, the build fails. The engineer must fix the underlying design issue (e.g., eliminating a circular call or routing traffic back through the API gateway) rather than accumulating technical debt.
Practical Case Study: Rescuing a Grade D Ledger Service
To illustrate the effectiveness of this matrix in practice, let’s examine an actual implementation from a high-throughput financial transaction platform.
The Ledger Service was a core microservice handling transaction bookkeeping. Over two years, the service began experiencing intermittent latency spikes and deployment gridlocks. A manual review of the service’s metrics revealed the following architectural metrics:
ledger_metrics = {
    'shared_db': True,              # The Ledger queried the Core Accounts database directly for optimization.
    'is_in_cycle': True,            # Ledger called Fraud Detection, which queried Notifications, which called Ledger.
    'fan_out': 8,                   # Standard maximum was 6.
    'unapproved_proto': False,
    'breaking_changes': 1,          # Changed JSON parameters on a public API without deprecation.
    'deprecated_ratio': 0.15,
    'gateway_bypass_ratio': 0.10,   # A legacy batch script was bypassing the Kong Gateway to hit the internal IP.
    'plaintext_bypass': False,
    'obsolete_stack': True,         # Running on Node.js 14 when the organization mandated Go/Java.
    'days_since_deploy': 210        # Had not been deployed in 7 months.
}
Using our analyzer engine:
- Coupling Score ($C$): $5.0\,(\text{DB}) + 3.0\,(\text{Cycle}) + 0.5 \times (8 - 6) = 9.0$
- Schema Score ($S$): $0.0 + (4.0 \times 1) + (2.0 \times 0.15) = 4.3$
- Infrastructure Score ($I$): $(5.0 \times 0.10) + 0.0 = 0.5$
- Lifecycle Score ($L$): $4.0 + 1.5 \times \ln(210 / 30) = 4.0 + 1.5 \times 1.9459 = 6.92$
Calculating the total ADI:
\[ADI = 0.40 \times 9.0 + 0.30 \times 4.3 + 0.20 \times 0.5 + 0.10 \times 6.92 = 3.6 + 1.29 + 0.1 + 0.69 = 5.68\]At an ADI of 5.68, the Ledger Service was graded Grade D.
Under the rules of the Architectural Drift Matrix, the deployment pipeline blocked all non-emergency production releases. The engineering team was forced to allocate two sprints to architectural remediation:
- Database Decoupling: The direct queries to the
Accounts DBwere eliminated. The ledger team implemented a Kafka listener to asynchronously replicate account status changes into the Ledger’s own database. This dropped $D_{db}$ to0, reducing $C$ by5.0. - Cycle Elimination: The notification system was refactored to use asynchronous events, breaking the circular dependency ($N_{cyclic} = 0$).
- Upgrade & Deployment: The service was rewritten in Go, using Protobuf for schema verification and updating the runtime dependencies.
Following these changes, the metrics returned to:
remediated_metrics = {
    'shared_db': False,
    'is_in_cycle': False,
    'fan_out': 3,
    'unapproved_proto': False,
    'breaking_changes': 0,
    'deprecated_ratio': 0.0,
    'gateway_bypass_ratio': 0.0,
    'plaintext_bypass': False,
    'obsolete_stack': False,
    'days_since_deploy': 1
}
This reduced the ADI to:
\[ADI = 0.40 \times 0.0 + 0.30 \times 0.0 + 0.20 \times 0.0 + 0.10 \times 0.0 = 0.0\]The service returned to Grade A. In the six months following remediation, the transaction platform saw a 40% reduction in P99 latency, zero deployment rollbacks, and experienced zero cascading failures during seasonal traffic spikes.
Conclusion: Making Architecture Quantifiable
Architectural review boards and large diagrams on virtual whiteboards are insufficient for maintaining design integrity in high-growth engineering organizations. When architectural standards are enforced only through occasional audits, they will inevitably yield to the pressure of feature delivery deadlines.
By implementing the Architectural Drift Index (ADI), organizations convert subjective opinions about code quality into a strict, mathematical standard. This framework:
- Exposes silent design violations in real time.
- Enables technical leads to communicate the necessity of refactoring in clear, quantitative terms to non-technical stakeholders.
- Guarantees that system reliability scales in step with feature complexity.
Do not wait for your next major outage to discover that your system has deteriorated into a distributed monolith. Implement continuous drift tracking, embed the ADI in your release pipelines, and let the data safeguard your architecture.