A Quantitative Framework for Measuring Technical Debt Principal and Interest via Code Complexity and Bug Rate Correlation
A rigorous, data-driven framework to quantify technical debt principal and interest using AST complexity, git churn, and production bug correlations.
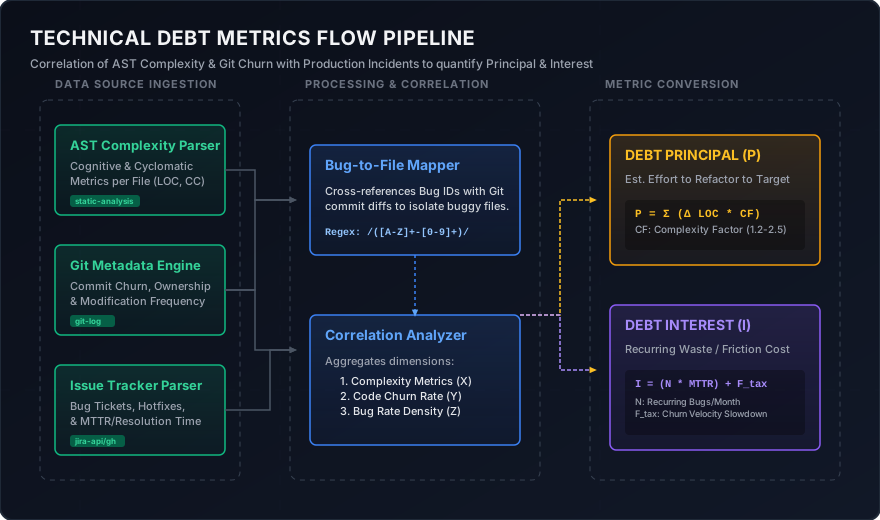
Imagine standing in front of your VP of Product, trying to explain why your team needs to halt all feature work for three weeks to refactor the payment gateway service. You point to a 4,000-line Go file, citing "bad code quality" and "low maintainability." The VP nods politely but points out that the quarterly revenue target depends on releasing the subscription upgrade next week. You lose the argument, not because the code doesn’t need refactoring, but because you brought qualitative complaints to a quantitative table. To product management, your "architectural purity" is a luxury; to the business, delaying features has a concrete dollar cost. To win this argument and make rational engineering decisions, you must speak the language of finance: Principal and Interest. Technical debt is not a metaphor; it is an active ledger. This article details a quantitative framework that extracts AST-based code complexity, correlates it with git commit history (churn) and production bug tracking logs (Jira/GitHub), and computes the exact developer-hour cost of your technical debt’s Principal (cost to fix) and Interest (cost to ignore).
Defining the Financial Ledger: Principal vs. Interest
To bridge the gap between engineering reality and business management, we must define technical debt using standard financial metrics:
- Principal ($P$): The one-time engineering cost to pay down the technical debt. This is the estimated developer-hours required to refactor the code to meet the target architectural standards (e.g., cyclomatic complexity < 10, cognitive complexity < 15, clean test coverage).
- Interest ($I$): The ongoing, recurring cost of maintaining the bad code. This interest is paid in two ways:
- Triage and Remediation Tax ($I_{\text{bugs}}$): The developer-hours spent debugging, fixing, testing, and deploying patches for production bugs originating in the high-debt modules.
- Friction and Velocity Tax ($I_{\text{friction}}$): The slowdown in feature development. A developer modifying a high-complexity module takes significantly longer to implement a change than they would in a clean, modular class because of cognitive overload, brittle dependencies, and lack of test confidence.
If you don’t pay the principal, you pay the interest forever. Crucially, if a piece of code is highly complex but has a churn rate of zero (i.e., it is stable, working, and never modified), it generates no interest. Refactoring a zero-interest module is an expensive waste of engineering resources. Conversely, a moderately complex module with extremely high churn and frequent bug rates is a high-interest credit card that must be paid down immediately.
Data Ingestion Pipeline: Harvesting the Raw Metrics
To build this ledger, we need data from three disconnected systems: the source code (AST structure), the version control system (Git history), and the ticket tracking database (Jira/GitHub Issues). Let’s look at how to extract these metrics cleanly.
1. Code Complexity (AST Analysis)
We measure code complexity at the file level using Abstract Syntax Tree (AST) parsing. Standard lines of code (LOC) is a poor proxy for complexity. We use two main metrics:
- Cyclomatic Complexity (CC): The number of linearly independent paths through the code. It is useful for identifying control-flow bloat.
- Cognitive Complexity (CoC): A metric that assesses how difficult the code is to understand for a human reader, accounting for nested structures, boolean chains, and readability breaks.
For a Go codebase, we can run gocognit and gocyclo. In Node.js, we use eslint with complexity rules. The output is parsed into a CSV mapping file_path to its respective complexity score.
# Run gocognit to find cognitive complexity and export to CSV
gocognit -over 10 . | awk '{print $4 "," $1}' > complexity.csv
2. Git Churn Extraction
Code churn represents how often a file is modified. High churn indicates active development or high fragility. We extract the number of commits, lines added, and lines deleted per file over a rolling 90-day window. Here is a bash pipeline to extract churn per file:
git log --numstat --since="90 days ago" | \
  awk 'NF==3 {added[$3]+=$1; deleted[$3]+=$2; commits[$3]++} END {for (f in added) print f "," commits[f] "," added[f] "," deleted[f]}' > git_stats.csv
3. Production Incident Attribution
To calculate Interest, we must associate production bugs with specific files. This requires a strict engineering convention: every bug fix commit must reference the ticketing ID (e.g., [HOTFIX-1209] or JIRA-4820).
Using this link, we query our ticket tracker API (Jira, GitHub, or linear) to retrieve the resolution time (Mean Time to Repair - MTTR) and severity for each ticket.
# Find all commits containing bug ticket patterns, and list the files changed
git log --grep="[A-Z]\+-[0-9]\+" --grep="fix" --grep="bug" -i --name-only --since="90 days ago" | \
  grep -v '^$' | \
  sort | \
  uniq -c > bug_churn.csv
The Mathematical Framework
Now, we define the mathematical model to tie these metrics together.
Let $F$ be the set of files in our codebase. For each file $f \in F$:
- Let $C_f$ be the Cognitive Complexity of the file.
- Let $L_f$ be the lines of code (LOC).
- Let $H_f$ be the churn rate (number of commits in the analysis period, e.g., 90 days).
- Let $B_f$ be the number of production bugs linked to the file in the analysis period.
- Let $T_f$ be the total developer-hours spent resolving bugs in file $f$ (retrieved from ticketing time tracking or estimated via average MTTR).
1. Estimating Principal ($P_f$)
The Principal represents the effort required to reduce the complexity of file $f$ to a baseline standard (e.g., $C_{\text{target}} = 15$). The refactoring effort is proportional to the size of the file ($L_f$) adjusted by a non-linear Complexity Factor ($CF_f$). The Complexity Factor scales quadratically as complexity increases, reflecting the exponential difficulty of refactoring bloated files:
\[CF_f = \left(\frac{C_f}{C_{\text{target}}}\right)^2 \quad \text{for } C_f > C_{\text{target}}, \text{ else } 1.0\]The estimated refactoring effort in developer-hours is:
\[P_f = \text{Base Rate} \times L_f \times CF_f\]Where the Base Rate is an organization-specific constant representing the average time to write/refactor one line of clean, tested code. A realistic baseline for senior backend teams is $0.05$ hours per line (or 20 lines of production code per hour, including writing tests, code review, and CI pipelines).
2. Estimating Interest ($I_f$)
The monthly Interest rate is calculated as the sum of direct bug-fixing cost ($I_{\text{bugs}}$) and velocity friction cost ($I_{\text{friction}}$):
\[I_f = I_{\text{bugs}, f} + I_{\text{friction}, f}\]Where:
- Direct Incident Cost: \(I_{\text{bugs}, f} = \frac{T_f}{\text{Months in Period}}\) If time tracking is unavailable, we estimate $T_f = B_f \times \text{Average MTTR}$. Let’s assume an average MTTR of $6$ developer-hours per incident (triage, code fix, unit test, code review, deployment).
- Friction Velocity Cost:
When developers touch complex files, they take longer. We model this as:
\(I_{\text{friction}, f} = H_f \times \text{Average Commit Time} \times \text{Friction Factor}_f\)
Where:
Average Commit Timeis the average developer time spent on a single code change (typically 4–8 hours for backend tasks).- The
Friction Factorrepresents the percentage slowdown. We model this as: \(\text{Friction Factor}_f = \min\left(0.5, \frac{C_f - C_{\text{target}}}{C_{\text{target}}}\right) \quad \text{for } C_f > C_{\text{target}}, \text{ else } 0.0\) This caps the friction penalty at $50\%$.
3. The Technical Debt Interest Rate (TDIR)
The annualized interest rate for a given file is:
\[\text{TDIR}_f = \frac{I_f \times 12}{P_f}\]If a file has a TDIR of $200\%$, it means the team pays double the cost of refactoring in maintenance waste every single year. This provides an absolute, dollar-denominated justification for refactoring.
Concrete Implementation: The Python Analyzer
Below is a practical Python script to implement this quantitative analyzer. It parses CSVs generated from your AST tools, Git log analysis, and Jira exporter, correlates them, and prints a prioritized refactoring queue.
import pandas as pd
import numpy as np

# Config Parameters
C_TARGET = 15          # Cognitive Complexity baseline
BASE_RATE = 0.05       # 20 LOC per hour to rewrite/refactor
AVG_MTTR = 6.0         # 6 hours per production incident fix
AVG_COMMIT_TIME = 8.0  # 8 hours average task duration per commit
ANALYSIS_MONTHS = 3.0  # 90-day window

def analyze_tech_debt(complexity_file, git_stats_file, bugs_file):
    # Load datasets
    # complexity.csv: file_path,loc,complexity
    df_comp = pd.read_csv(complexity_file)

    # git_stats.csv: file_path,commits,lines_added,lines_deleted
    df_git = pd.read_csv(git_stats_file)

    # bugs.csv: file_path,bug_count
    df_bugs = pd.read_csv(bugs_file)

    # Merge datasets
    df = df_comp.merge(df_git, on='file_path', how='outer')
    df = df.merge(df_bugs, on='file_path', how='left')
    df['bug_count'] = df['bug_count'].fillna(0)
    df = df.dropna(subset=['complexity', 'commits']) # Ignore untouched files

    # Calculate Principal (P)
    df['complexity_factor'] = np.where(
        df['complexity'] > C_TARGET,
        (df['complexity'] / C_TARGET) ** 2,
        1.0
    )
    df['principal_hours'] = df['loc'] * BASE_RATE * df['complexity_factor']

    # Calculate Interest (I)
    df['interest_bugs_monthly'] = (df['bug_count'] * AVG_MTTR) / ANALYSIS_MONTHS

    df['friction_factor'] = np.where(
        df['complexity'] > C_TARGET,
        np.minimum(0.5, (df['complexity'] - C_TARGET) / C_TARGET),
        0.0
    )
    df['interest_friction_monthly'] = (
        df['commits'] * AVG_COMMIT_TIME * df['friction_factor']
    ) / ANALYSIS_MONTHS

    df['interest_hours_monthly'] = df['interest_bugs_monthly'] + df['interest_friction_monthly']
    df['annualized_interest_hours'] = df['interest_hours_monthly'] * 12

    # Calculate Technical Debt Interest Rate (TDIR)
    df['tdir'] = np.where(
        df['principal_hours'] > 0,
        (df['annualized_interest_hours'] / df['principal_hours']) * 100,
        0.0
    )

    # Sort by Annualized Interest (highest operational drain first)
    df = df.sort_values(by='annualized_interest_hours', ascending=False)
    return df

if __name__ == '__main__':
    results = analyze_tech_debt('complexity.csv', 'git_stats.csv', 'bugs.csv')
    print(results[['file_path', 'complexity', 'commits', 'bug_count', 'principal_hours', 'interest_hours_monthly', 'tdir']].head(10))
A Production Case Study: The Payments Monolith
Let’s perform a concrete walkthrough of this framework applied to a real-world scenario. Assume a backend microservice written in Go responsible for processing payments. The codebase has three main hotspots:
pkg/payment/charge.go: A monolithic file that handles credit card processing, local storage syncing, email receipts, and legacy retry mechanisms.pkg/payment/gateway_client.go: A client communicating with Stripe. High complexity because of legacy error-mapping code, but rarely changed.pkg/payment/subscription.go: The subscription state machine. Active development, moderate complexity, frequent integration bugs.
Let’s look at the metrics gathered over a 90-day window:
| File Path | LOC | Cognitive Complexity ($C_f$) | Churn (Commits $H_f$) | Bugs Count ($B_f$) |
|---|---|---|---|---|
pkg/payment/charge.go |
4,200 | 45 | 36 | 12 |
pkg/payment/gateway_client.go |
1,200 | 38 | 2 | 1 |
pkg/payment/subscription.go |
1,800 | 22 | 48 | 8 |
Let’s compute the Principal, Monthly Interest, and TDIR for each file using our formulas.
File 1: pkg/payment/charge.go
- Complexity Factor: $CF = (45 / 15)^2 = 3.0^2 = 9.0$.
- Principal ($P$): $P = 0.05 \times 4,200 \times 9.0 = 1,890$ developer-hours. This indicates that rewriting this file cleanly would require approximately 1,890 hours (roughly 1 engineer working for 11 months or a dedicated team of 3 working for ~3.5 months).
- Monthly Bug Interest: $I_{\text{bugs}} = (12 \text{ bugs} \times 6 \text{ hours}) / 3 \text{ months} = 24$ hours/month.
- Friction Factor: $\text{Friction Factor} = \min(0.5, (45 - 15) / 15) = 0.5$ (maximum penalty of $50\%$).
- Monthly Friction Interest: $I_{\text{friction}} = (36 \text{ commits} \times 8 \text{ hours} \times 0.5) / 3 \text{ months} = 48$ hours/month.
- Total Monthly Interest: $24 + 48 = 72$ hours/month.
- Annualized Interest: $72 \times 12 = 864$ hours/year.
- TDIR: $(864 / 1,890) \times 100 = 45.7\%$.
This is a classic "Big Debt" item. The principal is massive, and while it drains $72$ developer-hours every month (nearly half of one full-time engineer’s capacity), the interest rate is a manageable $45.7\%$. Refactoring this file requires significant investment, and the payback period is around 2.2 years ($1,890 / 864$).
File 2: pkg/payment/gateway_client.go
- Complexity Factor: $CF = (38 / 15)^2 = 2.53^2 = 6.42$.
- Principal ($P$): $P = 0.05 \times 1,200 \times 6.42 = 385.2$ developer-hours.
- Monthly Bug Interest: $I_{\text{bugs}} = (1 \text{ bug} \times 6 \text{ hours}) / 3 \text{ months} = 2$ hours/month.
- Friction Factor: $\text{Friction Factor} = \min(0.5, (38 - 15) / 15) = 0.5$.
- Monthly Friction Interest: $I_{\text{friction}} = (2 \text{ commits} \times 8 \text{ hours} \times 0.5) / 3 \text{ months} = 2.67$ hours/month.
- Total Monthly Interest: $2 + 2.67 = 4.67$ hours/month.
- Annualized Interest: $4.67 \times 12 = 56$ hours/year.
- TDIR: $(56 / 385.2) \times 100 = 14.5\%$.
This file has high complexity, but because of its low churn (only 2 commits in 90 days), the actual operational drag is negligible. Paying down this debt is a poor use of engineering time. The payback period is almost 7 years. Do not touch this file.
File 3: pkg/payment/subscription.go
- Complexity Factor: $CF = (22 / 15)^2 = 1.46^2 = 2.15$.
- Principal ($P$): $P = 0.05 \times 1,800 \times 2.15 = 193.5$ developer-hours.
- Monthly Bug Interest: $I_{\text{bugs}} = (8 \text{ bugs} \times 6 \text{ hours}) / 3 \text{ months} = 16$ hours/month.
- Friction Factor: $\text{Friction Factor} = \min(0.5, (22 - 15) / 15) = 0.46$.
- Monthly Friction Interest: $I_{\text{friction}} = (48 \text{ commits} \times 8 \text{ hours} \times 0.46) / 3 \text{ months} = 58.88$ hours/month.
- Total Monthly Interest: $16 + 58.88 = 74.88$ hours/month.
- Annualized Interest: $74.88 \times 12 = 898.56$ hours/year.
- TDIR: $(898.56 / 193.5) \times 100 = 464.3\%$.
Look at the contrast between charge.go and subscription.go. subscription.go has half the lines of code and less than half the cognitive complexity. However, because it is actively modified (48 commits) and leaks bugs (8 incidents), it drains $74.88$ hours of engineering time every single month—slightly more than the massive charge.go monolith.
Crucially, its interest rate is $464.3\%$. Paying down the debt on subscription.go costs only $193.5$ hours, but yields a massive return, saving the team nearly $900$ developer-hours annually. The payback period is less than three months. This is your highest priority refactoring target. This is the data-driven argument you present to product management.
Prioritizing Refactoring via ROI
By calculating the TDIR for every file in the codebase, we can plot our technical debt on a prioritization grid:
- High Churn, High Complexity (The Red Zone / High Interest): These are files like
subscription.go. They represent immediate financial bleeding. They must be prioritized for refactoring in the current or next sprint. - Low Churn, High Complexity (The Sleeping Giant): These are files like
gateway_client.go. They represent deep structural problems but are stable and generate no recurring costs. Leave them alone. Refactoring them is a vanity project. - High Churn, Low Complexity (Active Code): This is healthy code. It changes frequently but remains modular and easy to work with. No action needed.
- Low Churn, Low Complexity (Stable Code): The ideal state of software. No action needed.
To make this prioritization operational, establish a “Refactoring ROI Index” (RRI) and set threshold rules for team planning:
- Immediate Refactoring Target (TDIR > 100%): High operational tax. Refactoring pays for itself within 12 months.
- Targeted Refactoring (TDIR 50% - 100%): Schedule refactoring when feature velocity in this module starts to stall.
- Technical Debt Accept (TDIR < 20%): Accept the debt. Log it in the backlog but do not allocate engineering budget to it.
Common Pitfalls and Mitigation Strategies
While a quantitative framework brings objectivity, it is susceptible to gaming and systematic error. Here are the core failure modes to guard against in production:
1. Goodhart’s Law and "File Splitting"
Once developers discover that cognitive complexity and file size drive the "Refactoring Priority List," they may begin to game the system. A common manifestation is taking a complex 4,000-line class and splitting it into eight 500-line classes that import each other, keeping the underlying dependency mess intact but dropping individual file complexity metrics.
- Mitigation: Track System-Level Coupling alongside file-level complexity. Metrics like Afferent Coupling ($C_a$) and Efferent Coupling ($C_e$) help identify if complexity was simply swept under the rug of interface layers.
2. Commit Tagging Failures
If developers commit code changes without referencing bug keys (e.g., Jira keys or GitHub issue numbers) in their commit logs, your correlation engine will systematically underestimate $I_{\text{bugs}}$. This leads to artificially low Interest rates, hiding critical debt hotspots.
- Mitigation: Enforce commit message formatting in your CI/CD pipeline using pre-commit hooks or GitHub Action checks (e.g.,
commitlint). Commits that contain changes in thepkg/directory and are labeled as bug-fixes must include an active ticket ID pattern.
3. Misattributing the Root Cause
If developer Alice makes a patch in utils.go to fix a bug whose actual cause was a race condition in scheduler.go, the correlation engine will attribute the bug (and its MTTR time) to utils.go.
- Mitigation: Ensure your bug-to-file mapping scans the entire git commit history associated with the resolution ticket. If multiple files are involved, distribute the bug cost proportionally across the changed files based on the percentage of lines modified in each file.
Integrating Technical Debt into the Product Lifecycle
How do you build this into your day-to-day engineering processes?
- Nightly Analysis Pipeline: Set up a cron job in your CI runner that runs the complexity and git analysis script. Generate an HTML or JSON dashboard showing the rolling 90-day TDIR map.
- The "Debt Budget" Negotiation: Instead of arguing for arbitrary refactoring weeks, negotiate a dynamic technical debt budget based on your interest rates. If your monthly Interest ($I$) exceeds $15\%$ of your team’s total capacity (e.g., 60 hours per developer per month in a team of 5 is 300 hours; 15% is 45 hours), the team is authorized to automatically pull high-interest refactoring tickets into the sprint backlog without product management approval.
- Refactoring as a Feature: Treat high-interest refactoring tickets exactly like product features. They have estimated costs (Principal) and projected value (eliminated Interest, faster future task execution). If a product feature has an expected return of $50,000$ and a refactoring task saves the company $60,000$ in lost developer velocity and SLA violations, the refactoring task wins the prioritization queue.
By replacing qualitative hand-waving with an audit-ready ledger of Principal, Interest, and TDIR, you build trust with product management and business stakeholders. More importantly, you ensure that your engineering time is spent paying down the debts that actually cost you money, leaving the harmless complexity alone.