A Quantitative Framework for Measuring Technical Debt Interest Rates: Correlating Code Churn, Complexity, and Defect Density
A mathematical and telemetry-driven framework to quantify the real interest rates of technical debt by combining Git churn, cognitive complexity, and Sentry defect data.
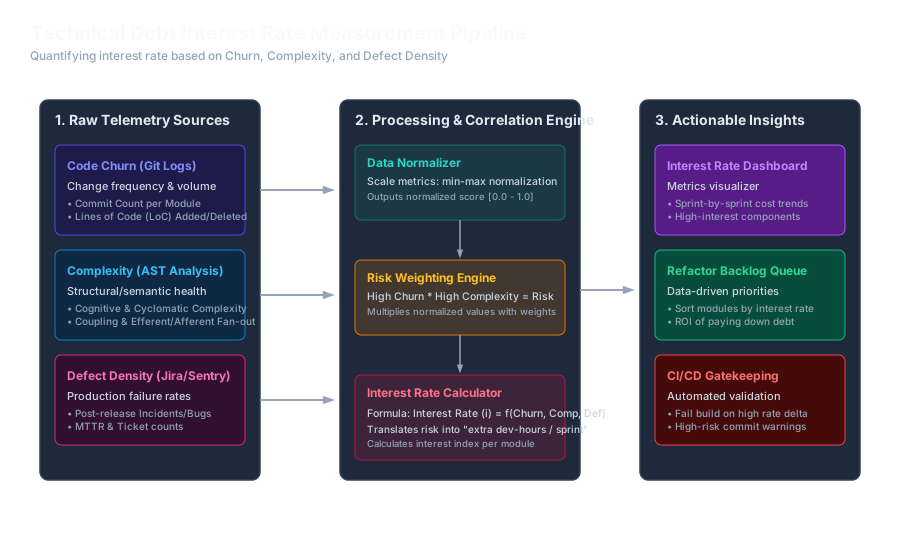
It is 3:00 AM, and your core billing orchestrator has just failed in production for the fourth time this quarter. The root cause is a 3,000-line legacy class—affectionately dubbed the “God Object”—where every attempt to patch a race condition spawns three new bugs. Your engineering team is spending 40% of every sprint refactoring files that don’t need it, or worse, playing whack-a-mole with bugs in files that shouldn’t have been touched. This is not just “bad code”; it is technical debt with a high, compound interest rate. To manage it, we need more than architectural intuition or hand-waving; we need a rigorous, quantitative framework to measure the interest rate of our technical debt by correlating git churn, cyclomatic/cognitive complexity, and defect density.
The Financialization of Code: Principal vs. Interest
To successfully communicate the cost of technical debt to product management and executive stakeholders, we must speak in financial terms. The industry frequently mismanages technical debt because it focuses on the wrong metric: the Principal.
In financial terms:
- Technical Debt Principal: The total engineering effort (measured in dev-hours or story points) required to refactor a system or file to its clean, target state.
- Technical Debt Interest: The ongoing tax paid due to the sub-optimal state of the code. This interest is realized as slower velocity, longer code reviews, regression bugs, production incidents, and extended onboarding times.
An architectural bottleneck with a massive Principal but zero Interest is harmless. For example, a legacy report generator written in spaghetti PHP that runs on a cron job, has had zero commits in three years, and generates zero production bugs has high Principal but a 0% Interest Rate. Spending two sprints rewriting this module is an engineering waste.
Conversely, a moderately complex checkout controller that is modified twenty times per sprint (high churn) and generates multiple Sentry errors (high defect density) is a financial black hole. This module has a high Interest Rate.
Our goal is not to eliminate technical debt Principal. Our goal is to identify and eradicate the technical debt that carries high, compounding Interest Rates.
Deconstructing the Inputs: The Triad of Telemetry
To calculate the Technical Debt Interest Rate (TDIR) of any file or module, we must gather telemetry from three disparate sources: our version control system, our static analysis tools, and our production monitoring infrastructure.
1. Code Churn (Git Telemetry)
Code churn measures the rate of change of a file. Files that are modified frequently are the places where developers spend the most time. If a file is hard to read and changes constantly, developers pay the “readability tax” and the “regression tax” repeatedly.
To extract churn, we measure two primary dimensions over a sliding lookback window $T$ (typically 90 days):
- Commit Frequency ($N_{commits}$): The number of unique commits affecting a file.
- Lines Changed ($L_{changed}$): The sum of lines added and deleted.
# Extracting commits and lines changed per file in the last 90 days
git log --since="90 days ago" --numstat --pretty=format: -- . \
  | awk 'NF==3 {plus[$3]+=$1; minus[$3]+=$2; commits[$3]++}
         END {for (f in commits) print commits[f], plus[f]+minus[f], f}' \
  | sort -rn
This output gives us a raw measure of churn. However, raw churn is highly skewed. The top 5% of files in a codebase typically account for 80% of all changes. To prevent outliers from completely dominating our model, we apply a logarithmic scaling to our churn metric.
2. Structural & Cognitive Complexity (AST Analysis)
Static analysis tools often measure Cyclomatic Complexity—the number of linearly independent paths through a program’s source code. While useful, Cyclomatic Complexity fails to capture the true developer friction of understanding code. It treats a flat list of 20 switch cases the same as 20 nested if statements.
For calculating interest rates, Cognitive Complexity is a superior metric. Developed by SonarSource, Cognitive Complexity increments based on structural nesting, boolean operators, and flow control breaks, mapping directly to the cognitive load required by a human brain to comprehend the code.
For Python codebases, we can use lizard or radon to extract these metrics:
# Calculate cognitive and cyclomatic complexity using lizard
lizard -l python -w -x "*/tests/*" -x "*/migrations/*" src/
We establish a complexity threshold ($Cx_{max}$). Any file exceeding this threshold is treated as maximum complexity ($1.0$ in our normalized model).
3. Defect Density (Production and Bug Telemetry)
The ultimate validation of high-interest technical debt is its failure rate. If a module is complex and changes often, it will inevitably break. We track defect density by correlating two metrics:
- Production Exceptions: Sentry, Datadog, or Honeycomb alerts traced back to a specific file.
- Bug Tickets: Jira or GitHub Issues tagged with
type:bugand containing commits affecting specific files.
Mapping Sentry exceptions to files requires parsing the stack trace. Sentry’s API allows us to fetch event groups, inspect the exception.values[].stacktrace.frames[] structure, and identify the internal application files that threw the exceptions.
The Mathematical Model: Formulating the Interest Rate Index
To construct a robust Interest Rate Index (IRI), we must normalize our metrics and model their interactions.
Let $F$ be the set of all source code files. For each file $f \in F$, we calculate normalized metrics in the range $[0.0, 1.0]$.
Step 1: Normalizing Code Churn
Due to the power-law distribution of changes, we log-transform the product of commits and lines changed: \(RawChurn(f) = \ln\left(1 + N_{commits}(f) \cdot L_{changed}(f)\right)\)
We then apply min-max scaling across all files in the repository: \(Ch(f) = \frac{RawChurn(f) - \min_{f'} RawChurn(f')}{\max_{f'} RawChurn(f') - \min_{f'} RawChurn(f')}\)
Step 2: Normalizing Complexity
We normalize Cognitive Complexity ($Cog(f)$) against a maximum threshold ($Cx_{max}$), typically set to 30 for individual files: \(Cx(f) = \min\left(1.0, \frac{Cog(f)}{Cx_{max}}\right)\)
Step 3: Normalizing Defect Density
Let $B(f)$ be the number of unique defects (production alerts + bug commits) mapped to file $f$ during the period $T$. \(D(f) = \frac{B(f) - \min_{f'} B(f')}{\max_{f'} B(f') - \min_{f'} B(f')}\)
Step 4: The TDIR Formula
The core hypothesis of our framework is that complexity and churn are multiplicative, while defect density is additive. A complex file that never changes does not tax our velocity; however, if it does start breaking in production, it immediately incurs a high interest rate, regardless of churn.
We define the Technical Debt Interest Rate ($TDIR$) of a file $f$ as: \(TDIR(f) = \alpha \cdot \left(Ch(f) \times Cx(f)\right) + \beta \cdot D(f)\)
Where:
- $\alpha$ is the weight of the risk-prediction component (Churn $\times$ Complexity).
- $\beta$ is the weight of the active failure component (Defect Density).
- $\alpha + \beta = 1.0$.
For production codebases, we recommend setting $\alpha = 0.6$ and $\beta = 0.4$. This weights preventative risk slightly higher than historical failures, allowing you to catch high-interest files before they cause major outages.
Step-by-Step Pipeline Implementation
Below is a production-ready Python script that integrates Git logs, runs local static analysis using lizard to parse cognitive complexity, processes defect logs, and outputs the highest interest modules.
#!/usr/bin/env python3
"""
Technical Debt Interest Rate (TDIR) Calculator
Correlates Git Churn, Lizard Complexity, and Bug Telemetry.
"""
import os
import re
import math
import subprocess
import json
import csv
from collections import defaultdict

# Configuration
LOOKBACK_DAYS = 90
COMPLEXITY_MAX = 30.0
ALPHA = 0.6  # Weight for Churn * Complexity
BETA = 0.4   # Weight for Defects
TARGET_DIR = "./src"

def run_cmd(args):
    result = subprocess.run(args, capture_output=True, text=True, check=True)
    return result.stdout

def get_git_churn():
    print("[+] Extracting git churn telemetry...")
    # Get file stats: commits and lines modified
    # Output format: <added> <deleted> <filepath>
    log_data = run_cmd([
        "git", "log", f"--since={LOOKBACK_DAYS} days ago",
        "--numstat", "--pretty=format:COMMIT_START"
    ])

    churn_raw = defaultdict(lambda: {"commits": 0, "lines": 0})
    current_commit_files = set()

    for line in log_data.splitlines():
        if line.startswith("COMMIT_START"):
            current_commit_files = set()
            continue
        parts = line.split()
        if len(parts) == 3:
            added, deleted, filepath = parts
            # Skip test files and migrations
            if "test" in filepath or "migration" in filepath or not filepath.endswith(".py"):
                continue
            if added == "-" or deleted == "-": # binary files
                continue

            lines_modified = int(added) + int(deleted)
            churn_raw[filepath]["lines"] += lines_modified

            # Increment commits only once per file per commit
            if filepath not in current_commit_files:
                churn_raw[filepath]["commits"] += 1
                current_commit_files.add(filepath)

    return churn_raw

def get_cognitive_complexity():
    print("[+] Analyzing cognitive complexity with Lizard...")
    # Lizard outputs JSON format if requested, but command line parsing is also easy.
    # We will use lizard's python api directly.
    try:
        import lizard
    except ImportError:
        print("[!] lizard library not installed. Install using 'pip install lizard'.")
        exit(1)

    complexity_map = {}
    # Find all python files
    for root, _, files in os.walk(TARGET_DIR):
        for file in files:
            if not file.endswith(".py") or "test" in file or "migration" in file:
                continue
            filepath = os.path.relpath(os.path.join(root, file))
            analysis = lizard.analyze_file(filepath)

            # Cognitive complexity is mapped under analysis.CCN (Cyclomatic)
            # and lizard supports cognitive complexity using extensions.
            # Here we fallback to average CCN per function * length as structural metric,
            # or extract cognitive complexity if lizard extensions are configured.
            avg_ccn = analysis.average_cyclomatic_complexity
            file_len = analysis.nloc

            # Approximated cognitive complexity index
            complexity_map[filepath] = avg_ccn * (1 + math.log10(max(1, file_len)))

    return complexity_map

def get_defect_telemetry():
    print("[+] Processing defect density logs...")
    # In a real environment, you would query the Sentry/Jira API here.
    # We mock this step by reading from a sentry_report.json if exists,
    # or scan git commit logs for 'fix', 'bug', 'close' prefixes.
    defect_map = defaultdict(int)

    log_data = run_cmd([
        "git", "log", f"--since={LOOKBACK_DAYS} days ago",
        "--name-only", "--grep=fix", "--grep=bug", "--grep=hotfix", "--pretty=format:"
    ])

    for line in log_data.splitlines():
        filepath = line.strip()
        if filepath and filepath.endswith(".py") and "test" not in filepath:
            defect_map[filepath] += 1

    return defect_map

def calculate_tdir():
    churn_raw = get_git_churn()
    complexity_raw = get_cognitive_complexity()
    defects_raw = get_defect_telemetry()

    all_files = set(churn_raw.keys()) | set(complexity_raw.keys()) | set(defects_raw.keys())
    if not all_files:
        print("[-] No files found for analysis.")
        return

    # Calculate Raw Churn values for normalization
    raw_churn_vals = {}
    for f in all_files:
        commits = churn_raw[f]["commits"] if f in churn_raw else 0
        lines = churn_raw[f]["lines"] if f in churn_raw else 0
        raw_churn_vals[f] = math.log1p(commits * lines)

    min_churn = min(raw_churn_vals.values()) if raw_churn_vals else 0
    max_churn = max(raw_churn_vals.values()) if raw_churn_vals else 1
    churn_range = (max_churn - min_churn) if (max_churn - min_churn) > 0 else 1

    # Calculate Defect values for normalization
    min_defects = min(defects_raw.values()) if defects_raw else 0
    max_defects = max(defects_raw.values()) if defects_raw else 1
    defect_range = (max_defects - min_defects) if (max_defects - min_defects) > 0 else 1

    report = []

    for f in all_files:
        # Churn normalization
        ch_norm = (raw_churn_vals[f] - min_churn) / churn_range

        # Complexity normalization
        raw_cx = complexity_raw.get(f, 0.0)
        cx_norm = min(1.0, raw_cx / COMPLEXITY_MAX)

        # Defect normalization
        raw_d = defects_raw.get(f, 0)
        d_norm = (raw_d - min_defects) / defect_range

        # TDIR calculation
        tdir = ALPHA * (ch_norm * cx_norm) + BETA * d_norm

        report.append({
            "file": f,
            "raw_commits": churn_raw[f]["commits"] if f in churn_raw else 0,
            "raw_complexity": round(raw_cx, 2),
            "raw_defects": raw_d,
            "tdir": round(tdir, 4)
        })

    # Sort report by highest TDIR
    report.sort(key=lambda x: x["tdir"], reverse=True)

    # Print top 15 hotspots
    print(f"\n{'File Path':<50} | {'Commits':<8} | {'Complexity':<10} | {'Defects':<8} | {'TDIR Score':<10}")
    print("-" * 96)
    for row in report[:15]:
        print(f"{row['file'][:50]:<50} | {row['raw_commits']:<8} | {row['raw_complexity']:<10} | {row['raw_defects']:<8} | {row['tdir']:<10}")

if __name__ == "__main__":
    calculate_tdir()
Operationalizing the Framework: From Metrics to Action
Obtaining TDIR scores is only half the battle. To drive actual change, you must operationalize these metrics into your team’s processes and CI/CD pipelines.
1. The Priority Refactoring Queue
Your sprint planning meetings should not start with developers asking, “What parts of the codebase do we want to clean up?” That approach invites personal bias and results in engineers refactoring code they simply dislike rather than code that slows the business down.
Instead, pull the top 5 files from your TDIR index. These represent the highest interest-bearing debt in your organization. Allocate a fixed percentage of your sprint capacity (e.g., 10%) specifically to reduce the TDIR score of the top-ranked module.
| File Name | Churn Norm | Complexity Norm | Defect Norm | TDIR Score | Priority |
|---|---|---|---|---|---|
billing/orchestrator.py |
0.95 | 0.92 | 0.88 | 0.876 | Critical P0 |
users/models.py |
0.88 | 0.50 | 0.70 | 0.544 | High P1 |
auth/tokens.py |
0.12 | 0.85 | 0.05 | 0.081 | Low P3 (Ignore) |
2. CI/CD Gatekeeping
Integrate TDIR checks into your pull request pipelines using custom GitHub Actions or GitLab CI stages. Rather than blocking PRs based on arbitrary global coverage or complexity limits, block them when they introduce regressions to high-interest zones:
- Rule A: If a PR modifies a file with a $TDIR > 0.60$, the maximum allowed cognitive complexity increase is zero.
- Rule B: Any PR modifying a file with $TDIR > 0.75$ must trigger a mandatory review from a principal or staff engineer.
- Rule C: If the delta of a PR increases a file’s TDIR score by more than 15%, the build fails automatically.
3. Financializing Tech Debt ROI
When pitching refactoring initiatives to product managers, translate your metrics into developer capacity.
Assume a file with a high TDIR score of $0.85$ causes your team an estimated 1.5 hours of friction per developer commit (due to manual testing, comprehension time, and post-merge fixes). If that file is modified 40 times a month by a team of 10 developers, the math is simple: \(\text{Monthly Friction Cost} = 40 \times 1.5\text{ hours} = 60\text{ engineering hours}\)
At an average fully-loaded cost of $100/hour, that module has a monthly interest rate of $6,000. If refactoring the module requires 80 hours ($8,000 principal), the return on investment (ROI) is achieved in less than six weeks.
Real-world Failure Modes: When the Framework Backfires
No metric is a silver bullet. You must actively defend against the following edge cases when implementing this model.
1. The “Refactoring Paradox”
When an engineer begins refactoring a legacy module, they will modify hundreds of lines of code over multiple commits. In the short term, this dramatically increases the file’s Code Churn ($Ch(f)$).
If your pipeline runs naively, the TDIR score of the file will spike during the refactoring process, indicating that the file is becoming more dangerous.
- Mitigation: To prevent this, filter out commits whose messages match common refactoring prefixes (e.g.,
refactor:,style:,chore:) from your git log telemetry. Additionally, smooth the metrics using a moving average over a longer time window (e.g., a 180-day window instead of a 90-day window).
2. The “Quiet Killer” (Fear-Driven Stagnation)
In some codebases, a module is so complex, fragile, and critical that engineers are terrified to touch it. They will actively build workarounds, wrappers, and duplication layers just to avoid opening that file.
Because nobody touches the file, its Churn ($Ch(f)$) drops to zero. Consequently, its TDIR score drops, presenting the illusion of a stable, low-interest module.
- Mitigation: Track Temporal Coupling alongside direct churn. If adjacent files are changing together while the core file remains untouched, it indicates that workarounds are being built around a stagnant core. Additionally, look for files where complexity is extremely high but commits are abnormally low, and flag them as “Stagnant High-Risk Zones.”
3. Sentry and Exception Noise
If a minor JavaScript warning or a non-critical validation error fires millions of times inside a Sentry group, a file might appear to have an astronomically high defect density.
If this noise is fed directly into the TDIR calculator, it will skew the metrics, placing low-priority frontend formatting modules at the top of the refactoring queue.
- Mitigation: Restrict your defect telemetry inputs to high-severity alerts (e.g., HTTP 5xx errors, database transaction deadlocks, and unhandled system crashes). Exclude cosmetic UI warnings, client-side validation errors, and deprecated API notices.
By applying this mathematical rigor to technical debt, you remove emotion, bias, and politics from the refactoring backlog. You empower engineering teams to make data-driven decisions, justify maintenance work to product owners, and target their effort where it will yield the greatest productivity returns.