Designing a Quantitative Framework for Evaluating Microservices Consolidation vs Decomposition
A mathematical framework for senior backend engineers to quantitatively evaluate microservices consolidation vs decomposition based on network, database, and workflow metrics.
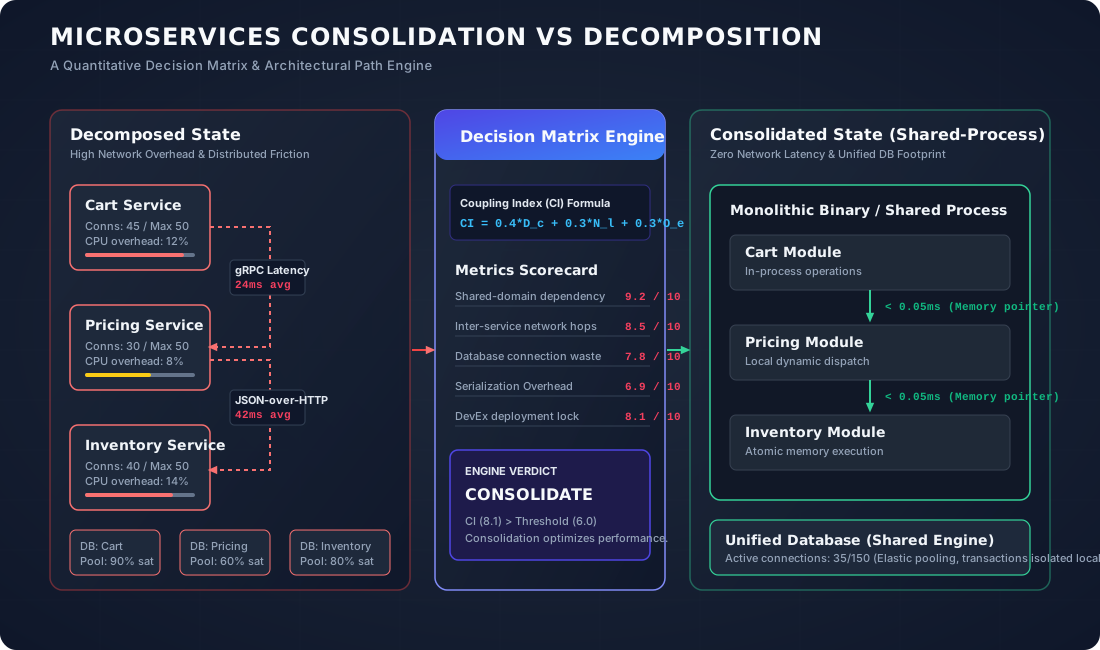
You are paged at 3:00 AM because your platform’s checkout endpoint p99 latency has spiked to 8.2 seconds, triggering a cascade of timeouts in the API gateway. You open Jaeger to trace the span and see a familiar, painful sight: a single checkout request executes a synchronous cascade of 14 nested gRPC calls across 8 microservices, eventually exhausting the PostgreSQL connection pool on the inventory service. The database server itself is idling at 15% CPU utilization; it is simply choked to death by the connection overhead and transaction coordination from multiple services querying it simultaneously to complete a single, logically atomic business transaction. This is the “microservices death by a thousand cuts”—a distributed monolith that combines the deployment complexity of distributed systems with the tight coupling of a legacy codebase. To solve this, engineering leaders cannot rely on architectural intuition or DDD purity; they need a cold, mathematical, and data-driven framework to evaluate when to consolidate over-decomposed microservices and when to decompose them further.
The Real Cost of Premature Decomposition
The industry-wide rush toward microservices in the mid-2010s was largely driven by organizational scaling issues (the “Two-Pizza Team” rule) rather than runtime efficiency. However, for most organizations, the operational complexity of distributed systems outweighs the benefits of decoupled deployment cycles. When a domain is split prematurely, it introduces hidden runtime taxes that directly degrade system reliability and throughput:
- The Network and Serialization Tax: A local in-memory function call takes less than a microsecond (often nanoseconds). A gRPC call over a loopback interface takes between 1.5ms to 3ms under load. Introduce AWS VPC routing, Envoy sidecar proxies (such as Istio or Linkerd), and TLS termination, and a single internal network hop consumes 5ms to 15ms. If your transactional flow requires 5 synchronous hops, you have spent 25ms to 75ms of your latency budget on TCP handshakes, TLS overhead, and Protobuf/JSON serialization before a single line of business logic executes.
- Database Connection Exhaustion: Each microservice maintains its own database connection pool (e.g., via HikariCP or PgBouncer). When a system is decomposed into 10 services, all querying the same underlying database cluster (even on different schemas), the total number of concurrent database connections scales multiplicatively. PostgreSQL allocates a process per connection, consuming roughly 10MB of memory per idle process and causing severe lock contention on
shared_buffersas connection count scales into the thousands. - The Distributed Transaction Fallacy: The moment a write operation spans two microservices, you lose ACID guarantees. Implementing a Saga pattern with compensating transactions introduces significant telemetry overhead, increases storage requirements for out-of-order execution logging, and creates eventual consistency windows that bubble up as UX issues (e.g., an item showing as “in stock” during payment but failing post-authorization).
To move away from faith-based architecture, backend engineering teams must deploy a quantitative model that measures these inefficiencies and flags services that are prime candidates for consolidation.
Dimensions of the Quantitative Framework
An effective evaluation framework must analyze three core dimensions of your system: Network Topology, Data Coupling, and Operational Velocity. Each dimension is represented by a normalized index between 0.0 (perfectly decoupled) and 1.0 (critically coupled).
1. Network Coupling Index ($N_c$)
The Network Coupling Index measures the latency and CPU cycles wasted on network transport and serialization relative to actual compute execution. To calculate $N_c$ for a target transaction pathway across two services $S_1$ and $S_2$, analyze the execution traces using OpenTelemetry and Jaeger:
\[N_c = \frac{T_{\text{network}} + T_{\text{serialization}}}{T_{\text{total}}}\]Where:
- $T_{\text{network}}$ is the total time spent waiting on network I/O between $S_1$ and $S_2$.
- $T_{\text{serialization}}$ is the CPU time spent encoding and decoding payloads (JSON, Protobuf, Avro) on both sides.
- $T_{\text{total}}$ is the total wall-clock time of the transaction span.
Production Thresholds:
- $N_c < 0.20$: Decoupled. The service is compute-heavy or performs asynchronous, batch-oriented processing.
- $N_c > 0.50$: Severely Coupled. Over half of the transaction time is wasted transit overhead. This is a primary indicator that the network boundary is arbitrary and the services should be consolidated.
2. Data Coupling Index ($D_c$)
Data coupling occurs when services cannot complete their workflows without access to the same transaction context or data entities. We measure this using two metrics: the Distributed Write Ratio ($R_{dw}$) and the Shared Entity Access Index ($R_{sea}$):
\[D_c = \alpha \cdot R_{dw} + \beta \cdot R_{sea}\]Where:
- $R_{dw} = \frac{\text{Transactions requiring cross-service writes}}{\text{Total write transactions}}$
- $R_{sea} = \frac{\text{Queries requiring cross-service JOINs or sequential fetches}}{\text{Total query transactions}}$
- $\alpha$ and $\beta$ are weights (typically configured as $\alpha = 0.6$ and $\beta = 0.4$ to penalize write coupling heavily).
If a “Promo Service” cannot calculate a discount without querying the “Cart Service” and the “User Profile Service” synchronously for every page view, $R_{sea}$ approaches 1.0. If database schemas are shared, or if Service A directly reads from Service B’s database tables, $D_c$ is immediately set to 1.0, indicating a critical architectural violation.
3. Operational Friction Index ($O_f$)
Architectural decoupling should reflect organizational decoupling. If two services are owned by different teams but require lock-step releases, the operational overhead spikes. We calculate the Operational Friction Index using Git commit logs and CI/CD deployment metadata over a 90-day window:
\[O_f = \frac{\text{Commits requiring changes to both } S_1 \text{ and } S_2}{\text{Total commits across } S_1 \text{ and } S_2} \times \left(1 + \frac{\Delta T_{\text{deploy\_delay}}}{T_{\text{standard\_deploy}}}\right)\]Where:
- $\Delta T_{\text{deploy_delay}}$ is the average time a pull request in $S_1$ sits waiting for a corresponding API contract change in $S_2$ to be deployed to production.
- $T_{\text{standard_deploy}}$ is the baseline deployment pipeline run-time for an isolated service.
An $O_f > 0.40$ indicates that developers are writing “distributed pull requests”—changing code in multiple repositories to implement a single feature. This destroys the main organizational benefit of microservices: team autonomy.
Mathematical Modeling: The Consolidation Score ($CS$)
To make a final decision, we combine these indices into a single, weighted metric called the Consolidation Score ($CS$):
\[CS(S_1, S_2) = w_n \cdot N_c + w_d \cdot D_c + w_o \cdot O_f\]Where the weights must satisfy:
\[w_n + w_d + w_o = 1.0\]For high-throughput, low-latency applications (e.g., e-commerce checkouts, ad-tech platforms, or financial clearing systems), network performance and database connection limits are the primary constraints. Therefore, we weight the inputs as follows:
- $w_n = 0.4$ (Network Coupling)
- $w_d = 0.4$ (Data Coupling)
- $w_o = 0.2$ (Operational Friction)
Decision Matrix
| CS Range | Recommendation | Action Plan |
|---|---|---|
| $0.0 \le CS < 0.4$ | Maintain Separation | The services are clean, autonomous, and run efficiently. |
| $0.4 \le CS < 0.6$ | Monitor / Refactor | The boundary is noisy. Implement caching (e.g., Redis sidecars) to reduce network hops, or clean up API contracts. |
| $0.6 \le CS \le 1.0$ | Consolidate | Merge the services. The operational and network cost of separation is degrading performance and developer velocity. |
Concrete Calculation Scenario
Let’s calculate the Consolidation Score for a Go-based e-commerce backend with two services: Cart-Service and Pricing-Service.
1. Network Coupling Index ($N_c$) calculation:
- p95 trace duration for checkout: 150ms.
- Network transit time between
Cart-ServiceandPricing-Service: 65ms (includes gRPC serialization and TLS handshake overhead over Envoy sidecars). - Compute time: 85ms.
- $N_c = 65 / 150 = 0.433$
2. Data Coupling Index ($D_c$) calculation:
- Every write to the cart database requires a synchronous check against the pricing database to validate item pricing and apply cart-level discounts.
- 95% of write transactions span both services: $R_{dw} = 0.95$.
- 80% of cart queries fetch pricing rules synchronously: $R_{sea} = 0.80$.
- $D_c = (0.6 \times 0.95) + (0.4 \times 0.80) = 0.57 + 0.32 = 0.89$
3. Operational Friction Index ($O_f$) calculation:
- Over 90 days, 35 out of 100 total commits required modifying both repositories.
- Average deployment delay due to contract syncing: 4 hours.
- Standard deployment run-time: 0.5 hours.
- $O_f = 0.35 \times (1 + (4 / 0.5)) = 0.35 \times 9 = 3.15$
- Normalized to a max value of 1.0: $O_f \rightarrow 1.0$ (due to critical deployment blocking).
4. Total Consolidation Score ($CS$):
\(CS = (0.4 \times 0.433) + (0.4 \times 0.89) + (0.2 \times 1.0)\) \(CS = 0.173 + 0.356 + 0.20 = 0.729\)
With a score of 0.729, the matrix demands immediate consolidation. Keeping these services separate is wasting infrastructure budget and slowing down deployment pipelines.
Execution Plan: Safely Consolidating Services
Consolidating microservices is not as simple as copy-pasting code into a single folder. You must execute a phased migration to ensure zero downtime and prevent regressions.
Phase 1: Establish In-Memory Interface Boundaries
Before merging codebases, refactor the communication layer. If Cart-Service calls Pricing-Service via a gRPC client, isolate this client behind a clean interface:
// interface.go
type PricingEngine interface {
    CalculatePrice(ctx context.Context, req *PricingRequest) (*PricingResponse, error)
}
Implement this interface using your existing gRPC client. This step ensures that the calling code (Cart-Service) is completely decoupled from the transport mechanism.
Phase 2: Code Integration (Mono-binary or Monorepo)
Bring the source code of both services into a single repository. If you are using a monorepo, they can remain in separate folders. If you are merging them into a single deployable unit (a “macroservice” or modular monolith), instantiate both packages inside a single application startup process.
Replace the gRPC-backed implementation of PricingEngine with a local, in-memory implementation that invokes the pricing domain logic directly via Go channels or direct function calls:
// local_pricing.go
type LocalPricingService struct {
    repo pricing.Repository
}

func (s *LocalPricingService) CalculatePrice(ctx context.Context, req *PricingRequest) (*PricingResponse, error) {
    // Invoke domain logic directly, bypassing the network card, Envoy sidecars, and serialization
    rules, err := s.repo.GetActiveRules(ctx, req.ItemId)
    if err != nil {
        return nil, err
    }
    return pricing.ApplyRules(rules, req.CartDetails), nil
}
By switching to LocalPricingService, you instantly reduce the $T_{\text{network}} + T_{\text{serialization}}$ for this call to 0ms.
Phase 3: Database Consolidation
Never merge databases on day one. Keep the database schemas isolated even if they now reside in the same PostgreSQL cluster.
- Step 1 (Logical separation in unified DB): Move both schemas to a single RDS instance using separate PostgreSQL namespaces (schemas). This allows you to scale down connection pools and query across schemas using standard ACID transactions without distributed transaction coordinators.
- Step 2 (Connection Pooling Optimization): Point both modules to the same RDS instance. Since they reside in the same application process, they can share a single, elastic connection pool managed by the container lifecycle.
- Step 3 (ACID Transition): Replace distributed Sagas with standard database transactions. Use database-level locks (
SELECT ... FOR UPDATE) or optimistic concurrency control (versionchecks) to handle race conditions reliably.
Phase 4: Zero-Downtime Traffic Migration
To migrate traffic safely, use Envoy or Istio to execute a canary rollout:
- Deploy the Consolidated Binary: Deploy the new, merged binary alongside the legacy isolated services. The new binary should run both the cart and pricing modules.
- Shadow Routing: Use Envoy’s
request_mirror_policiesto mirror 10% of checkout traffic to the consolidated service. Discard the response of the shadow service but log execution times and verify that the output database states match exactly. - Canary Shifting: Incrementally route live write traffic to the consolidated service: 1% $\rightarrow$ 10% $\rightarrow$ 50% $\rightarrow$ 100%. Monitor pg_stat_activity for connection surges and check p99 latencies.
- Decommission: Tear down the legacy, isolated
Cart-ServiceandPricing-Serviceinstances once metrics stabilize.
When Decomposition is Warranted
A quantitative framework must also protect you from consolidating services that genuinely benefit from physical isolation. You should halt consolidation or initiate decomposition if any of the following counter-metrics are triggered:
1. Resource Footprint Divergence
If Service A runs on a JVM with a heap size of 32GB to perform complex data aggregations, and Service B is a lightweight Go microservice running on 100MB of RAM that routes high-throughput API traffic, merging them is a operational risk. A garbage collection pause (Stop-The-World) on the JVM would immediately freeze the high-throughput Go module, violating the availability requirements of the system.
2. Strict Security and Compliance Zones
If Service A processes credit card numbers and falls under PCI-DSS compliance, it requires strict network isolation, database encryption, and audit logs. Merging it with Service B (e.g., user reviews) pulls the entire combined service into the PCI-DSS compliance scope, drastically increasing audit costs and slow-tracking all future code deployments.
3. Asymmetric Scaling Patterns
If Service A experiences extreme traffic spikes (e.g., ingestion of IoT telemetry) requiring the service to scale from 5 to 500 pods in seconds, while Service B maintains long-lived WebSockets connections that scale slowly, keeping them in the same process will lead to CPU starvation and drop socket connections during scaling events.
Conclusion
Architectural decisions should not be based on fashion. Decoupled deployment pipelines look good in slide decks, but they are expensive at runtime. If your system metrics show high network transit overhead, database connection exhaustion, and deployment synchronization problems, your architecture is telling you to merge.
Use this quantitative framework to analyze your services, calculate your Consolidation Score, and let the data guide your architectural decisions. Your latency budget and your database connection limits will thank you.