Preventing Privilege Escalation in Kubernetes via eBPF-Based Dynamic Seccomp Profile Generation and Enforcement
Implement zero-trust container security by leveraging eBPF to dynamically trace syscalls and generate custom Seccomp profiles in Kubernetes.
In a production Kubernetes cluster, compromised application containers are a vector for host kernel exploitation and cluster-wide privilege escalation. Even when running with allowPrivilegeEscalation: false and as a non-root user, a container that incurs a Remote Code Execution (RCE) vulnerability remains exposed to the host kernel’s entire syscall interface—numbering over 350 system calls. If a vulnerability like CVE-2024-21626 (runc container breakout) or a kernel exploit such as DirtyPipe (CVE-2022-0847) is targeted, an attacker can leverage unrestricted syscall access to override read-only filesystems, manipulate namespaces, or inject malicious kernel modules. By auditing and constraining these system calls to the absolute minimum required using eBPF-based dynamic Seccomp (Secure Computing Mode) profiling, we can lock down the kernel-space boundary and ensure that arbitrary code execution fails at the kernel interface level.
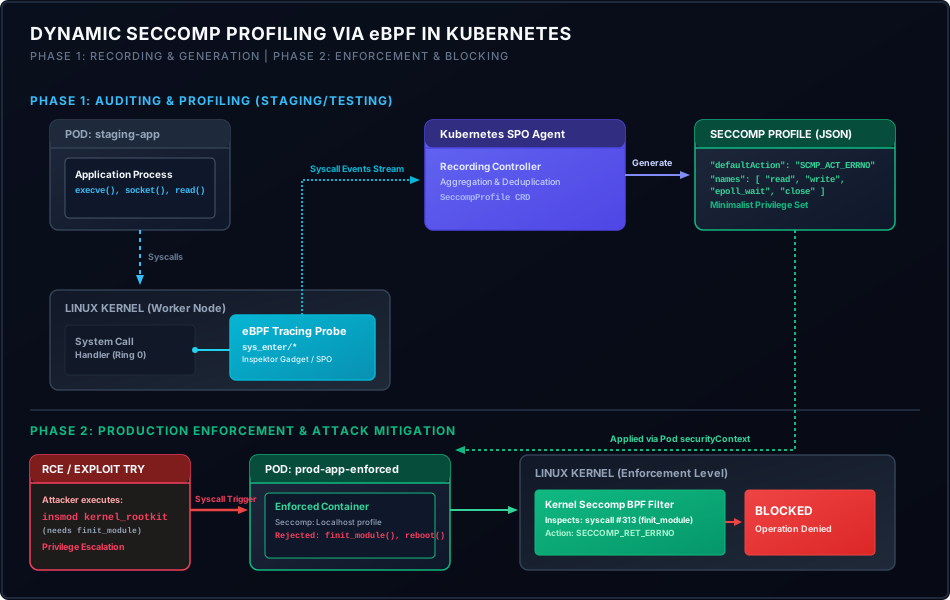
The Attack Surface: Why Default Seccomp is Insufficient
By default, Kubernetes uses the container runtime’s default Seccomp profile (such as the default Docker or containerd profile) unless configured otherwise. While this default profile blocks highly hazardous syscalls like reboot, kexec_load, and direct hardware access via ioperm, it still allows approximately 60% of all Linux system calls. This permissive posture is chosen for compatibility: it allows common developer tools, debugging engines, and dynamic runtimes (like Go, JVM, and Node.js) to function without throwing unexpected EPERM (Permission Denied) errors.
However, this compatibility creates a major window of opportunity for attackers:
- Thread Manipulation (
clone/unshare): Although restricted, certain flags can still be passed to system call wrappers to abuse user namespaces or manipulate namespaces if the kernel has configuration gaps. - Process Inspection (
ptrace): While often restricted by default Docker cap sets, if a container run contains additional capabilities (such asSYS_PTRACEfor debugging sidecars), an attacker can inspect and inject code into other processes. - Advanced File Operations (
finit_module/mount): Any capability leaks or kernel vulnerabilities might allow mounting host filesystems or loading unauthorized kernel modules. - Network Arbitrage (
socket/listen/connect): A compromised container can compile and run network scanners or establish reverse shells using raw sockets.
To secure a cluster, workloads must run under a “least privilege” Seccomp profile. A minimal profile limits a microservice to only the system calls required for its core functionality—typically around 30 to 50 system calls out of the 350+ available.
The Seccomp Dilemma: Why Static Profiles Fail
Creating and maintaining minimal Seccomp profiles manually is a operational bottleneck. If you run a simple Go service, compiling a list of system calls requires trace analysis during staging. Runtimes dynamically make system calls that change depending on:
- The base OS image (e.g., Alpine vs. Debian glibc dynamic linkers).
- Runtime garbage collection sweeps (
madvise,futex). - Third-party monitoring libraries (which may call
getrusageorperf_event_open). - Security agents or APM tools attached to the process.
If a developer manually maintains a static JSON file, any dependency update or minor code change (e.g., adding an outgoing HTTPS client, which introduces DNS resolution and new socket system calls) can trigger a container crash in production.
To solve this, we use the Kubernetes Security Profiles Operator (SPO) coupled with eBPF (Extended Berkeley Packet Filter). Rather than relying on unreliable static analysis or performance-heavy strace audits, we hook directly into the kernel’s sys_enter tracepoints. By tracing the workload during integration tests in a staging environment, we capture every system call executed across all threads, deduplicate the list, and write a customized Seccomp profile CRD.
Configuring eBPF-Based Profile Recording in Kubernetes
The Security Profiles Operator leverages an eBPF daemon running on each worker node to trace syscalls. When a ProfileRecording custom resource is created, the SPO controller tells its daemon to attach a BPF probe to the raw_syscalls/sys_enter tracepoint. The probe intercepts calls and filters them by container ID, mapping container namespace info directly to the target pods.
Here is the configuration for a production-grade ProfileRecording manifest designed to monitor a payment processor microservice:
This resource tells the operator to monitor any Pod with the label app: payment-service in the core-payments namespace using the eBPF (bpf) engine. The BPF recorder is vastly superior to the alternative logs recorder (which parses system audit logs), as it is completely out-of-band, incurs less than 1% CPU overhead, and is immune to log loss or syslog daemon crashes.
Under the Hood: The eBPF Tracing Probe
To understand how the BPF recorder captures system calls, we inspect the behavior of a raw tracepoint probe. The probe hooks into the Linux kernel’s syscall entry point.
When a process executes a system call, it triggers a software interrupt, transitioning from user space (Ring 3) to kernel space (Ring 0). The kernel executes the handler defined at the tracepoint raw_syscalls/sys_enter. The BPF program attached to this tracepoint extracts the syscall number from the context and records it.
Here is a simplified C-based eBPF tracepoint program demonstrating how system call numbers are traced and filtered by PID and thread group ID:
The operator collects these tracked IDs, translates the numeric IDs to system call names (e.g., 313 to finit_module), and maps them to the associated Pod name. After the staging test suite completes, the operator outputs a minimal SeccompProfile CRD containing only the mapped syscalls.
The Generated Minimal Seccomp Profile
Once the integration test run completes, the recording is finalized, and the SPO generates a SeccompProfile. Below is the resulting generated profile. Notice that it defaults to blocking all non-listed system calls using SCMP_ACT_ERRNO (which returns a standard permission denied error to the caller) instead of the permissive default behavior.
This profile is highly restrictive. Basic utilities like shell environments, dynamic module loaders, and debugging interfaces will fail instantly because system calls like ptrace, finit_module, reboot, and unshare are completely omitted from the allowed list, triggering SCMP_ACT_ERRNO on execution.
Enforcing the Profile in Production
To apply this dynamically generated profile in production, we configure the Kubernetes Pod’s security context. The Security Profiles Operator saves profiles to the node’s local Seccomp path (usually /var/lib/kubelet/seccomp/operator/<namespace>/<name>.json).
To reference this profile, set the seccompProfile.type to Localhost and specify the relative path.
By adding allowPrivilegeEscalation: false along with the specific Seccomp localhost profile, we create a secure execution sandbox. Even if a zero-day exploit allows an attacker to execute shellcode within this container, they will be unable to run privilege escalation commands because the underlying system calls are blocked by the kernel.
Verifying Enforced Profiles: A Practical Exploit Simulation
To verify that the enforcement works as designed, we can run a test program inside the container sandbox to simulate a kernel module loading exploit. A typical privilege escalation exploit might attempt to call finit_module to inject a rootkit directly into kernel memory. Under our minimal Seccomp profile, this call must fail.
Below is a verification script written in Go that attempts to load a kernel module using raw syscall commands. If the Seccomp profile is functioning correctly, the operation will fail with EPERM (Operation not permitted) or EACCES (Permission denied).
If you compile this verification script, inject it into your deployment image, and run it, you should see the following output in the logs:
Exploit payload blocked: operation not permitted
Verification Success: Kernel Seccomp filter caught and denied the syscall.
Monitoring and Alerting on Seccomp Violations
Enforcement is only half the battle. If a Seccomp violation occurs in production, it indicates one of two scenarios:
- Active Compromise: An attacker is actively trying to run unauthorized system calls (e.g. attempting to mount directories or run debugging tools).
- Profile Drift: A new code update or dependency was introduced, and it is failing to run because a required system call is being blocked.
To handle both cases, we must alert on Seccomp violations immediately. The Linux kernel logs Seccomp violations to the system audit framework (auditd). These events appear in system logs as type=1326 audit(..): pgid=... sig=31 arch=c000003e syscall=313 compat=0 ip=... code=0x00050000.
Using kube-state-metrics or node-level log exporters like Grafana Promtail / Loki, we can track these logs and emit metrics. Below is a Prometheus monitoring alert rule configured to trigger when container system call violations are detected:
If an alert triggers in Prometheus, incident response can quickly determine whether it was a security event or an operational issue by checking the namespace, Pod name, and the specific blocked system call.
Production Edge Cases & CI/CD Integration
Implementing dynamic Seccomp profiles in a continuous delivery pipeline requires addressing several practical challenges:
1. The Dynamic Linker Pitfall
When writing profiles in compiled languages like Go, system call dependencies are predictable. However, languages like Python, Ruby, or Node.js rely on shared libraries dynamically loaded during execution. A dynamic library loading call (dlopen) can trigger a wave of different file-system and memory allocation system calls (such as mprotect, arch_prctl, set_tid_address) depending on the host OS libc version. Ensure that your staging integration tests exercise the complete loading sequence of all dependencies.
2. Handling CPU/Memory Multi-Threading
Dynamic runtimes use multi-threaded execution models (like Go’s goroutine scheduler). System calls like clone and sigaltstack are frequently invoked to spin up scheduler threads and manage system signals. If your recording profile misses these scheduling system calls, the application will crash during high load. Load-testing the application during recording is critical to triggering all scheduler-level system calls.
3. CI/CD Lifecycle Automation
To prevent profile drift, incorporate recording into the deployment cycle:
- Build Phase: Compile code and build container images.
- Staging Phase: Deploy target Pods with the
ProfileRecordingCRD. Run exhaustive end-to-end integration and load tests. - Extraction Phase: Retrieve the generated
SeccompProfileCRD, commit it to the application repository, and package it along with Helm charts. - Production Phase: Deploy the application using the validated
SeccompProfile, establishing a secure runtime environment.
By moving Seccomp profile generation into your automated pipeline, you remove manual overhead and maintain a minimal attack surface for every application release.