Mitigating Kafka Consumer Rebalance Storms: Tuning Session Timeouts and Static Membership in High-Throughput Clusters
Mitigate expensive rebalance storms in high-throughput Kafka clusters by tuning session timeouts and configuring static membership with group.instance.id.
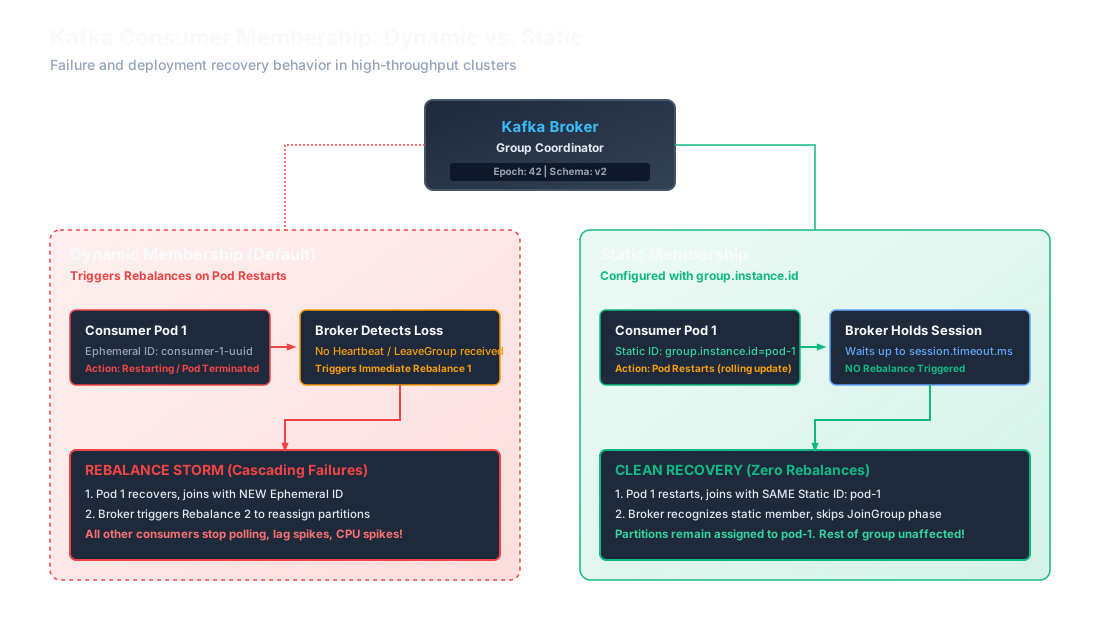
Imagine a high-throughput microservices architecture processing 50,000 events per second. It is 3:00 AM, and a routine Kubernetes rolling update is triggered for the payment consumer service. Within minutes, the group coordinator broker’s CPU spikes to 100%, network throughput drops to near zero, and consumer lag rises exponentially across all partitions. In the logs, a repetitive loop of PreparingRebalance and SyncGroup messages indicates that the cluster is caught in a devastating rebalance storm. Dynamic consumer membership, while elegant in theory for small workloads, is a production liability under heavy load. A single consumer node restarting or experiencing a brief stop-the-world garbage collection pause triggers a cascade of partition revocations, forcing all other healthy nodes to stop processing, flush offsets, and rejoin the group. This guide breaks down the core mechanics of Kafka group coordination, explains the failure modes of dynamic membership, and provides concrete steps to implement static membership and optimized timeouts for maximum stability.
Under the Hood: Kafka Group Coordination and Thread Models
To understand why rebalance storms happen, we must examine how Kafka manages group membership and partition assignment. The coordinator for a consumer group is a designated Kafka broker. The specific broker is determined by hashing the consumer group ID and mapping it to a partition of the internal __consumer_offsets topic:
The leader of that partition’s replica set becomes the Group Coordinator for that consumer group.
On the client side, modern Kafka consumer libraries (both Java and the C-based librdkafka wrapper used in Go and Python) separate concerns using a multi-threaded architecture:
- The User Application Thread: This thread runs the user’s event loop, calling
.poll()(or its client-equivalent) to fetch a batch of records, process them, and commit offsets. - The Background Heartbeat Thread: A dedicated thread that manages the connection to the Group Coordinator. Its sole responsibility is to send heartbeat requests to the broker at intervals defined by
heartbeat.interval.msto prove that the consumer instance is alive.
When a consumer starts up or triggers a rebalance under dynamic membership, the client protocol executes two distinct phases:
- JoinGroup: Every member of the consumer group sends a
JoinGrouprequest to the coordinator. The broker collects these requests. Once all known members have joined (or the join timeout expires), the broker selects one member as the Group Leader (typically the first one to send the request) and returns the list of all active members to it. The other members receive a response indicating they are followers. - SyncGroup: The Group Leader is responsible for executing the client-side partition assignment strategy (e.g.,
CooperativeStickyAssignor). The leader calculates the partition assignments and sends them to the coordinator in aSyncGrouprequest. The followers also send emptySyncGrouprequests. The coordinator then distributes the assignments back to all members in the response, and consumption resumes.
The traditional rebalance protocol is Eager (using assignors like RangeAssignor or RoundRobinAssignor). It is a “stop-the-world” event. During a rebalance, all members must immediately halt consumption, revoke their partition ownerships, commit current offsets, and participate in the JoinGroup / SyncGroup handshake. Under heavy loads, this pause halts pipeline processing, causing upstream message buffers to fill and downstream services to starve.
Anatomy of a Rebalance Storm: The Primary Failure Modes
In high-throughput environments, dynamic membership leads to cascading failure loops. A rebalance storm typically begins with one of two distinct failure modes.
Failure Mode 1: Main Thread Starvation and max.poll.interval.ms Breaches
The max.poll.interval.ms parameter is a safety valve designed to detect hung consumer threads (e.g., deadlocks, infinite loops). If a consumer does not call .poll() within this window, the client library considers the thread dead, sends a LeaveGroup request, and shuts down the coordinator connection.
In high-throughput systems, this limit is frequently breached due to downstream latency degradation:
- A consumer fetches a batch of 500 records.
- The database pool saturates, or a downstream API dependency degrades, causing the average processing time per record to jump from 10ms to 800ms.
- Total processing time for the batch rises to 400 seconds, breaching the default
max.poll.interval.msof 300 seconds (5 minutes). - The consumer client library actively leaves the group.
- The broker triggers a rebalance. The remaining active consumers are forced to stop processing, commit their progress, and rejoin.
- When the rebalance completes, the coordinator assigns the orphaned partitions to the remaining healthy consumers.
- These remaining consumers are now processing their own partitions plus the newly reassigned partitions. The increased load further saturates their resources, causing them to also breach their
max.poll.interval.mstimeout. - They leave the group, triggering another rebalance. The storm is now self-sustaining.
[2026-07-31 08:15:32,450] WARN [Consumer clientId=payment-worker-1, groupId=payment-processing-v1] Consumer poll/heartbeat thread missed liveness checks. session.timeout.ms elapsed without receiving heartbeat.
[2026-07-31 08:15:32,452] INFO [Consumer clientId=payment-worker-1, groupId=payment-processing-v1] Member payment-worker-1-uuid sending LeaveGroup request to coordinator.
Failure Mode 2: Network / Heartbeat Starvation and session.timeout.ms Breaches
Unlike the poll interval breach, a session timeout breach is detected by the broker. If the Group Coordinator does not receive a heartbeat from the background heartbeat thread within the session.timeout.ms window, it unilaterally evicts the member from the group.
This occurs under two common scenarios:
- JVM Garbage Collection Pauses: A long Stop-The-World (STW) G1GC pause halts all threads, including the background heartbeat thread. If the pause duration exceeds
session.timeout.ms, the broker marks the node as dead. - CPU Starvation on Kubernetes: In highly dense, overcommitted Kubernetes clusters, pods running without dedicated CPU limits or with low CPU shares can be starved of CPU cycles. The heartbeat thread fails to schedule on the OS scheduler in time, missing the timeout.
Once the broker evicts the member, it triggers a rebalance. When the starved node recovers (GC completes or CPU becomes available), it attempts to communicate with the broker, receives an UNKNOWN_MEMBER_ID error, and is forced to rejoin the group, triggering a second rebalance.
Tuning the Timeout Equation: Mathematical Reliability
To prevent these false evictions, you must configure your consumer timeout parameters based on the characteristics of your workload.
The timeout configurations are governed by a set of guidelines:
-
Heartbeat to Session Timeout Ratio: \(T_{\text{heartbeat}} \le \frac{1}{3} \times T_{\text{session}}\) This ensures that the consumer can miss up to two consecutive heartbeats due to minor network jitter or brief garbage collection pauses without triggering a rebalance.
-
Session Timeout to Pod Lifecycle: \(T_{\text{session}} > T_{\text{gc\_pause\_max}} + T_{\text{network\_latency}}\) For modern Java applications on G1GC, we recommend setting
session.timeout.msto at least 45,000ms. For systems with large JVM heaps (e.g., > 16GB) or distributed networks, 60,000ms to 90,000ms is safer. -
Max Poll Interval Formula: \(T_{\text{poll}} \ge (N_{\text{records}} \times t_{\text{worst\_case\_processing}}) + t_{\text{overhead}}\) Where:
- $N_{\text{records}}$ is
max.poll.records. - $t_{\text{worst_case_processing}}$ is the worst-case processing time per record (accounting for downstream service timeouts and retry attempts).
- $t_{\text{overhead}}$ is a safety buffer for serialization and database connection acquisition.
- $N_{\text{records}}$ is
For example, if your application processes batches of 500 records, and your downstream HTTP clients have a 1-second connect/read timeout with 3 retries, the worst-case processing time per record is 3 seconds. Your max.poll.interval.ms must be configured to at least:
Alternatively, you should reduce max.poll.records to 100, which reduces the required poll timeout:
Static Membership: The Silver Bullet for Kubernetes Deployments
In a standard Kubernetes deployment, rolling updates create a predictable rebalance storm. When a pod is terminated, it sends a LeaveGroup request, triggering a rebalance. When the new pod starts up, it joins the group, triggering a second rebalance. If you have a deployment with 10 replicas, a rolling update will trigger up to 20 consecutive rebalances.
Static membership (introduced in Kafka 2.3 via KIP-345) solves this by decoupling the logical identity of a consumer from its transient network connection. It introduces the group.instance.id configuration.
When a consumer joins the group with a configured group.instance.id:
- The Group Coordinator registers the member using this static identifier rather than generating an ephemeral uuid-based member ID.
- When the consumer shuts down or restarts (e.g., during a rolling deployment), the client library does not send a
LeaveGrouprequest to the broker. - The coordinator broker detects the disconnect but holds the member’s partition assignments in a
pendingstate, allowing the slot to remain reserved for up tosession.timeout.ms. - The remaining group members continue consuming from their assigned partitions without interruption. No rebalance is triggered.
- When the new pod restarts and re-registers with the same
group.instance.id, the coordinator maps the reserved partitions back to the consumer, resuming consumption immediately.
Static Membership Trade-offs
The primary trade-off of static membership is the handling of true failures. If a consumer pod experiences an unrecoverable failure (e.g., node hardware crash, permanent disk failure, out-of-memory loop) and does not rejoin, its assigned partitions will remain unconsumed for the duration of the session.timeout.ms before the coordinator evicts the static ID and triggers a rebalance.
Therefore, you must choose a session.timeout.ms that is long enough to tolerate a container restart (typically 60 to 90 seconds) but short enough to keep partition lag within acceptable limits in the event of a permanent node failure.
Production Configuration Snippets
The following implementations demonstrate how to configure static membership, tuned timeouts, and the cooperative sticky assignor across different runtimes and environments.
Snippet 1: Java/JVM Kafka Consumer Configuration
This snippet configures a Java consumer with static membership, G1GC-optimized timeouts, and the CooperativeStickyAssignor to minimize partition movement.
Snippet 2: Go confluent-kafka-go Configuration
This snippet uses the confluent-kafka-go library (wrapper for librdkafka) to configure a static consumer. Note that the library internally handles the avoidance of the LeaveGroup call on close when group.instance.id is present, provided you handle the shutdown process correctly.
Snippet 3: Kubernetes StatefulSet Manifest
Deployments with dynamic replicas are not suitable for static membership because pods receive random names (e.g. worker-86b7fd58c-abcde), which would generate a new static ID on every rollout, leaving the old static ID to expire over the full session.timeout.ms duration.
Instead, use a StatefulSet to ensure stable ordinal pod names (e.g. worker-0, worker-1) and project the name using the Downward API as the static instance ID.
# snippet-3
apiVersion: apps/v1
kind: StatefulSet
metadata:
  name: billing-consumer-worker
  namespace: finance-pipeline
spec:
  serviceName: "billing-consumer-hs"
  replicas: 3
  selector:
    matchLabels:
      app: billing-consumer-worker
  template:
    metadata:
      labels:
        app: billing-consumer-worker
    spec:
      terminationGracePeriodSeconds: 70
      containers:
      - name: worker
        image: registry.internal.mohashari.com/billing-worker:v2.1.0
        env:
        - name: KAFKA_BOOTSTRAP_SERVERS
          value: "kafka-cluster-kafka-bootstrap.kafka.svc:9092"
        - name: KAFKA_GROUP_ID
          value: "billing-processing-v2"
        # Extract the stable pod name (e.g., billing-consumer-worker-0) via Downward API
        - name: KAFKA_GROUP_INSTANCE_ID
          valueFrom:
            fieldRef:
              fieldPath: metadata.name
        resources:
          limits:
            cpu: "2"
            memory: 4Gi
          requests:
            cpu: "1"
            memory: 2Gi
        lifecycle:
          preStop:
            exec:
              command: ["/bin/sh", "-c", "sleep 15"]
Snippet 4: Go franz-go Configuration
This snippet uses the pure-Go library franz-go by Twilio, which is highly optimized for performance and provides direct configuration hooks for static membership.
Snippet 5: Prometheus / Alertmanager Rules
To monitor and prevent rebalance storms, implement these alerts using standard Kafka JMX metrics exported to Prometheus.
# snippet-5
groups:
  - name: kafka_rebalance_alerts
    rules:
      # Alert on sustained rebalance activity indicating a rebalance storm
      - alert: KafkaConsumerRebalanceStorm
        expr: sum(rate(kafka_consumer_coordinator_metrics_join_rate_total[5m])) by (group_id) > 0.05
        for: 10m
        labels:
          severity: critical
          tier: operations
        annotations:
          summary: "Kafka consumer group  rebalance storm detected"
          description: "The JoinGroup request rate is elevated (> 3 per hour average) for over 10 minutes. This indicates potential worker starvation, dynamic membership churn, or session timeouts being breached."

      # Alert on consumer lag spike indicating processing degradation
      - alert: KafkaConsumerLagSpike
        expr: sum(kafka_consumergroup_lag) by (group_id, topic) > 50000
        for: 5m
        labels:
          severity: warning
          tier: operations
        annotations:
          summary: "Critical consumer lag on  (topic: )"
          description: "Consumer lag has crossed 50,000 messages and has persisted for over 5 minutes. Verify downstream API/DB response times and check for concurrent consumer evictions."
Snippet 6: Admin CLI Verification Script
Use the native Kafka CLI tool to verify that the group has registered your static instance IDs successfully. Look for the #INST-ID column in the command output.
Observability: Telemetry and Critical Alerting Rules
Tuning timeouts and setting static IDs is only half the battle. Without observability, you will be blind to failures until lag triggers high-severity customer incidents.
Ensure your collector scraper (e.g., Prometheus JMX Exporter or Datadog Agent) gathers these metrics from the JVM or Client Metric Registry:
join-rateandsync-rate: Located in the JMX pathkafka.consumer:type=consumer-coordinator-metrics,client-id=*,name=join-rate. These should evaluate to exactly zero during normal operation. A spike during routine operation indicates a transient node failure, while a persistent value above zero indicates a rebalance storm.rebalance-latency-avg: Measures the duration of the rebalance phase in milliseconds. High rebalance latency (e.g., > 10,000ms) indicates massive group sizes or slow offset commit processes.heartbeat-rate: Tells you if the background thread is operating correctly. If this rate falls to zero while consumption is active, the node is likely experiencing CPU starvation.assigned-partitions: Tracks the count of partitions assigned to each worker pod. In a static membership configuration during a deployment, you will see this value temporarily drop to zero on a restarting pod while the broker holds its assignment in a pending state, and then immediately return to its original value upon re-joining without triggering a drop in the partition count of the remaining pods.
Production Playbook: Troubleshooting an Active Rebalance Storm
If you are paged for a critical lag alert and suspect a rebalance storm is in progress, follow this checklist to isolate and mitigate the failure:
- Verify Group State: Run the CLI command in Snippet 6. If the group state remains stuck in
PreparingRebalancefor minutes, the broker is repeatedly waiting for lagging or starved dynamic consumers to join. - Isolate Processing Bottlenecks: Inspect the application APM. Check the average transaction processing time for DB query latency or HTTP client call rates. If transaction processing duration is close to
max.poll.interval.ms, thread starvation is occurring. - Check GC Logs: Look at JVM garbage collection metrics. If G1GC stop-the-world times are exceeding 15 seconds, increase the JVM heap size, or optimize garbage collection flags (
-XX:MaxGCPauseMillis=200). - Isolate a Faulty Node: If a single node is crashing and restarting continuously, dynamic membership will repeatedly trigger rebalances. Scale down the StatefulSet/Deployment by one replica to isolate the failing container.
- Mitigation via Temporary Configuration Overrides: If downstream database bottlenecks cannot be resolved immediately, scale down the number of partitions processed per poll by reducing
max.poll.recordsor doublemax.poll.interval.msin your deployment configuration. This gives the consumers a larger safety margin to process heavy message batches during downstream slowdowns.