Implementing Pipeline Parallelism for Distributed Transformer Inference on Local Hardware Using Socket-Based IPC in Rust
A production-grade guide to implementing socket-based pipeline parallelism for distributed transformer inference on local hardware using Rust.
When running large transformer models (such as LLaMA-3-70B or Mixtral-8x22B) on local hardware rigs, the primary bottleneck is memory capacity. A 70-billion parameter model in 16-bit precision requires 140 GB of VRAM, which far exceeds the limits of standard consumer or local workstation GPUs. While tensor parallelism (TP) is the default choice for distributed setups, its heavy communication overhead—requiring frequent, blocking All-Reduce operations across heads—makes it unusable without expensive, high-bandwidth interconnects like NVIDIA NVLink. Over commoditized interfaces such as PCIe Gen 4 lanes or local gigabit Ethernet networks, TP-induced latency completely swallows any computational gains, reducing generation speed to a crawl. To overcome this interconnect bottleneck, senior engineers must leverage pipeline parallelism (PP). By splitting the model’s layers sequentially across multiple local nodes or process-isolated GPUs and routing intermediate activation tensors through a custom, socket-based inter-process communication (IPC) ring, we can sustain high-throughput token generation with minimal communication overhead.
The Interconnect Constraint: Why Tensor Parallelism Fails Locally
In distributed transformer inference, weight distribution across multiple nodes is essential, but the partitioning strategy determines whether your application achieves low latency or stalls on network I/O.
Tensor Parallelism splits individual weight matrices (such as attention projections) across devices. During the forward pass, every single layer requires two major synchronization points: one after self-attention and another after the MLP block. These synchronization points rely on All-Reduce collectives. For LLaMA-3-70B (80 layers, hidden dimension of 8192), this means every token generated requires 160 blocking network operations. At a batch size of 1, the transfer payloads are small, but the cumulative overhead of kernel-network transitions, packet serialization, and latency dominates. Over PCIe Gen 4 or a 10GbE network, the network transit time quickly exceeds the matrix multiplication time, leaving your GPUs idle.
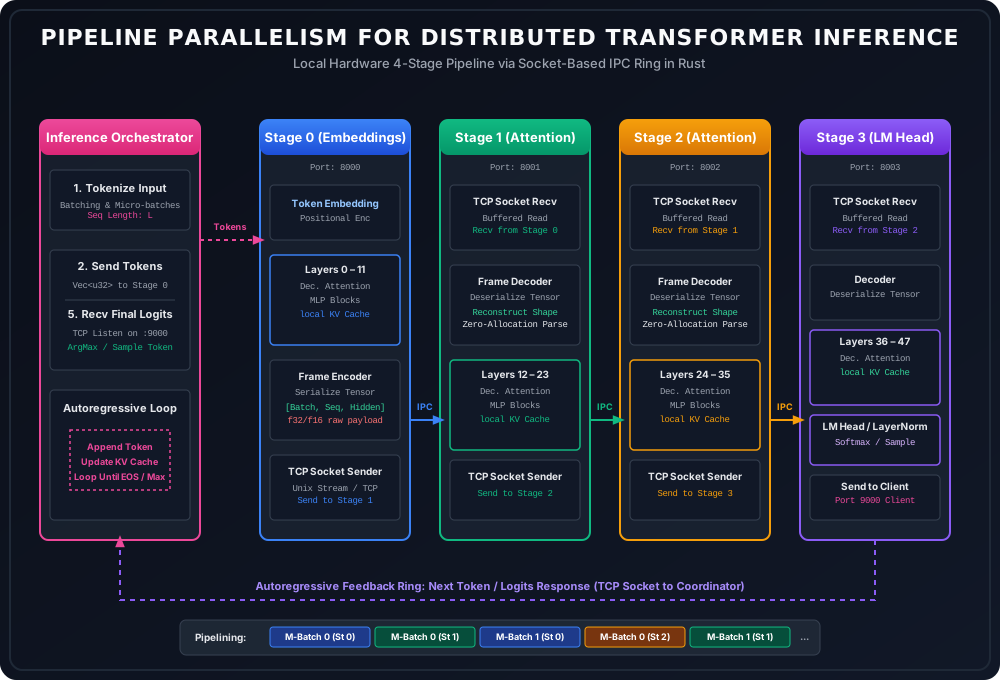
Pipeline Parallelism partitions layers sequentially. In a 4-node setup, Node 0 hosts Layers 0-11, Node 1 hosts Layers 12-23, and so on. Node 0 computes its layers and passes the output activation tensor to Node 1. For a hidden dimension of $d_{\text{model}} = 8192$ and FP16 precision, the activation tensor size for a sequence is $1 \times \text{SeqLen} \times 8192 \times 2$ bytes. For a single token during decoding ($\text{SeqLen} = 1$), the transfer size is only 16 KB. Instead of 160 network transfers per token, PP requires exactly 4 transfers (one between each stage boundary). This reduction in communication frequency makes it possible to scale inference on standard TCP sockets over consumer Ethernet, or across heterogeneous local PCIe slots.
Structuring a Zero-Copy Tensor Framing Protocol
Using high-level serialization formats like JSON, Protobuf, or gRPC for streaming activations introduces unacceptable latency. JSON requires floating-point string conversions that saturate CPU cycles. Protobuf requires allocating temporary memory blocks and wrapping them in dynamic envelopes, triggering high GC or memory allocator pressure. For distributed systems running at 30+ tokens per second, memory allocation in the critical I/O path must be zero.
We must define a binary, length-prefixed protocol directly matching the memory layout of raw tensors. The protocol consists of an 8-byte aligned header containing the packet metadata, followed immediately by the raw byte buffer of the float array. By aligning the header structures to 8-byte boundaries, we can deserialize the packet zero-copy using safe pointer slicing in Rust.
Minimizing IPC Latency: TCP Socket Tuning and Core Pinning
To run socket-based IPC locally, we must bypass Nagle’s algorithm by setting TCP_NODELAY. By default, the operating system attempts to coalesce small outgoing packets before writing them to the network. During decoding, our 16 KB activation tensor is small enough to trigger Nagle’s delay, adding up to 40 ms of latency per hop. Setting TCP_NODELAY tells the TCP stack to push data packets immediately.
Furthermore, standard Linux thread scheduling is highly dynamic. The kernel scheduler routinely migrates socket-reader threads across physical CPU cores to balance thermal loads. Every time a thread is migrated, the CPU L1 and L2 caches are invalidated, resulting in TLB thrashing. To secure consistent sub-millisecond latencies, we pin the socket reader loop to a dedicated CPU core using the core_affinity crate.
The Pipeline Stage Execution Loop
Each execution stage handles its subset of transformer layers. When an activation tensor is received, the stage decodes the raw byte array into floating-point variables, updates its internal Key-Value (KV) cache, executes the local layer attention blocks, and passes the updated activations downstream.
Managing Distributed KV Cache
During token generation, recomputing the key-value states of prior tokens is wasteful. The KV Cache stores the Key and Value matrices of historical tokens. In a pipeline parallel setup, the KV Cache is distributed across nodes according to their assigned layers (e.g. Stage 0 caches key-value vectors for layers 0-11, Stage 1 for 12-23).
Because different generation requests execute concurrently in a multi-user environment, we must track KV Caches indexed by a combination of sequence_id and micro_batch_id. The cache must support low-overhead reads and writes, avoiding allocation churn by reusing pre-allocated memory slices.
Saturating the Pipeline: Micro-batching and Pipelined Scheduling
If a request flows sequentially through the pipeline, only one node is active at any given moment. For a 4-stage pipeline, this results in a maximum theoretical hardware utilization of only 25% (the “pipeline bubble”).
To eliminate this bubble, we implement micro-batching. The main inference request batch (size $B$) is divided into $M$ smaller micro-batches. When Node 0 completes processing Micro-batch 0, it pushes the activation to Node 1. Instead of sitting idle, Node 0 immediately starts processing Micro-batch 1.
We construct a scheduling state machine that monitors the incoming channel, reads activation frames, processes them through our local stage, and writes them directly to the downstream node’s TCP stream.
Orchestrating the Autoregressive Ring Loop
The coordinator node is responsible for managing the generation cycle. It tokenizes the prompt, submits the token IDs to the first stage (Stage 0), listens on a dedicated server port for the final stage (Stage 3) to output the computed logits, samples the next token (using greedy argmax or temperature sampling), appends the token to the context, and routes the new token back to Stage 0. This creates an autoregressive feedback ring.
Production Failure Modes and Operational Runbooks
Deploying custom pipeline parallel inference setups on local commodity hardware introduces physical limitations that do not exist in dedicated cloud clusters. Below are the core failure modes and the mechanisms needed to mitigate them.
1. TCP Buffer Bloat and Deadlocks
In a pipeline parallel ring, if Stage 0 pushes micro-batches faster than downstream stages can compute, send buffers fill up and write calls block. If all nodes block writing downstream while waiting to read from upstream, a ring deadlock occurs.
- Mitigation: Enforce a strict credit-based flow control system. The coordinator must track the number of outstanding micro-batches. If the count of outstanding micro-batches exceeds the number of stages ($P$), the coordinator must block sending new token packets until downstream completions free up slots.
2. Deserialization Pointer Alignment Faults
In Snippet 5, we cast raw byte slices directly into float slices &[f32] using slice::from_raw_parts. Casting a pointer to a type that has stricter alignment requirements without ensuring correct pointer offset leads to undefined behavior. In some architectures, it causes a physical hardware exception, causing the inference binary to crash with SIGBUS.
- Mitigation: Ensure that socket-read buffers are initialized using aligned structures. In Rust, you can use aligned byte arrays or wrap the read buffers in structures that enforce
#[repr(align(4096))]. Alternatively, verify pointer offsets before casting:let offset = payload.as_ptr().align_offset(std::mem::align_of::<f32>()); if offset != 0 { // Fallback: Allocate and copy data to an aligned vector let aligned_vec: Vec<f32> = payload.chunks_exact(4) .map(|chunk| f32::from_ne_bytes(chunk.try_into().unwrap())) .collect(); }
3. KV Cache OOM Jitter
Unlike static compute tensors, KV cache footprint grows linearly with sequence length. On local machines with limited GPU memory, minor allocations during long queries can trigger CUDA out-of-memory errors.
- Mitigation: Implement strict memory pooling. Pre-allocate the entire KV Cache memory blocks on startup. If a sequence requests context beyond the pre-allocated pool limits, immediately return a resource exhaustion error code (
msg_type: 4) upstream instead of allowing the process to crash.