Building High-Throughput Event-Driven Architectures with RocksDB State Stores and Kafka
Eliminate remote database bottlenecks and slash latency by building distributed event processors with embedded RocksDB state stores and log-compacted Kafka changelogs.
When scaling real-time event-driven systems—such as real-time ad-tech bidding platforms, fraud detection scoring engines, or cellular billing ledgers—to process over 100,000 writes per second, standard centralized databases like PostgreSQL or Redis cluster quickly become your primary bottleneck. As you scale horizontally, network round-trip times (RTT), serialization overhead, connection pool exhaustion, and the astronomical cost of massive cloud-managed memory databases compound into an operational nightmare. Moving state out of the database and directly onto the local filesystem of your stream processing worker nodes via RocksDB—replicated asynchronously to Apache Kafka via log-compacted changelog topics—allows you to achieve sub-millisecond local reads and writes, decouple database scaling from throughput, and slash infrastructure costs by up to 80% while preserving absolute consistency and fault tolerance.
The Fallacy of Remote State Stores
In a traditional stateful application, microservices query a shared database or caching layer to enrich events, evaluate business rules, and save updates. This model is simple but fundamentally flawed for high-throughput stream processing.
Under load, network physics become an absolute ceiling. Consider a typical AWS deployment where a containerized Go service queries an Amazon ElastiCache Redis cluster in the same Availability Zone. The average network round-trip time (RTT) hovers around 0.5ms to 1.5ms. If your business logic requires three sequential read/write operations to process a single event, RTT alone introduces 1.5ms to 4.5ms of latency. This limits a single worker thread to a maximum throughput of 220 to 660 events per second.
To scale throughput, engineers typically spin up hundreds of concurrent worker threads. However, this creates a secondary failure mode: connection pool exhaustion and locking contention at the remote storage tier. If you attempt to pool 10,000 connections from 100 microservice pods to a Redis cluster, the cluster spends more CPU cycles managing connection state, TCP overhead, and thread contexts than executing commands.
Additionally, caching strategies (such as cache-aside or read-through) fall apart when dealing with long-tail access patterns. In real-time bidding or transactional ledger systems, keys are distributed across a wide range, leading to cache misses. When a cache miss occurs, the system falls back to the primary database, driving database CPU usage to 100% and causing a cascading system outage known as a cache stampede.
By eliminating the network boundary and embedding the state store inside the application process using RocksDB, reads and writes occur via in-memory pointers or local NVMe SSD storage. RTT drops from milliseconds to microseconds.
Why RocksDB? The Power of LSM-Trees
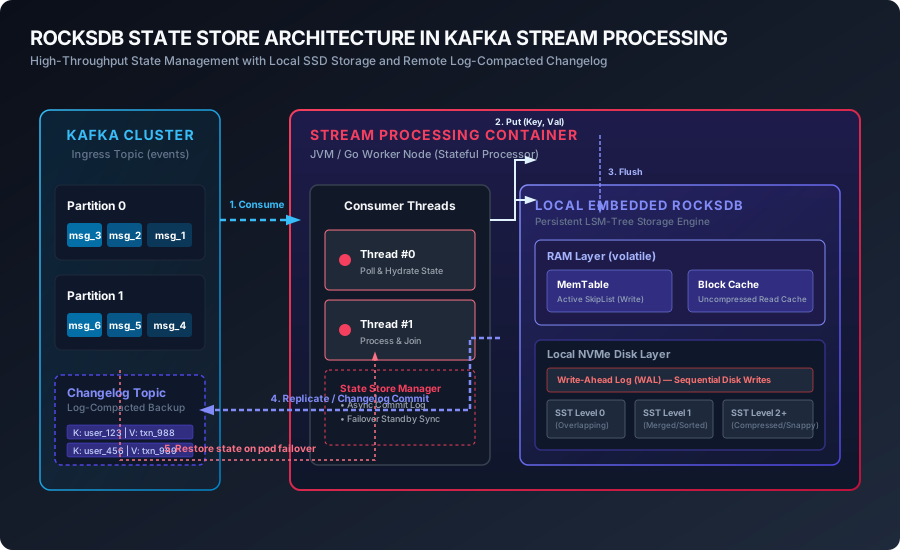
RocksDB is an embedded, high-performance key-value store optimized for fast, low-latency storage. Unlike relational databases that use B-Trees, RocksDB uses a Log-Structured Merge-Tree (LSM-Tree) architecture.
In a B-Tree, writes require modifying data pages in place. This translates to random disk I/O, which is slow and causes significant write amplification. LSM-Trees, conversely, optimize for write performance by converting random writes into sequential disk writes.
Here is how data flows through RocksDB during a write:
- Write-Ahead Log (WAL): The write is appended sequentially to the WAL on disk. This guarantees durability in the event of a power loss.
- MemTable: Simultaneously, the write is inserted into an in-memory sorted data structure called the MemTable (implemented as a lock-free SkipList). Once written to both the WAL and the MemTable, the write is considered complete, returning immediately to the caller.
- Flushing: When the active MemTable reaches its capacity limit (typically 64MB to 128MB), it becomes read-only, and a background thread flushes its sorted contents to disk as a Level 0 Sorted String Table (SST) file.
- Compaction: As SST files accumulate, RocksDB runs background compaction threads. These threads merge and sort SST files from Level $N$ into Level $N+1$, removing stale keys, duplicates, and deleted records (tombstones).
Because writes are append-only, write operations are extremely cheap. Reads are optimized through index structures, bloom filters, and block caches.
Tuning RocksDB for Production Container Environments
Running RocksDB inside containerized environments (such as Kubernetes pods) with default settings will quickly lead to container restarts due to out-of-memory (OOM) kills. RocksDB is written in C++ and allocates memory off-heap (outside the JVM or Go runtime control). Without explicit limits, RocksDB will consume memory until the Linux kernel steps in.
To prevent this, you must explicitly configure RocksDB’s Block Cache, MemTables, and Write Buffer Manager.
The Go snippet below demonstrates how to configure a production-ready RocksDB instance using gorocksdb. It isolates off-heap memory consumption and configures compaction parameters to prevent write stalls.
Implementing the Kafka-RocksDB Pipeline
To achieve maximum throughput, the state store must integrate directly into your Kafka consumer loop.
When processing events, never issue single Put commands to RocksDB for every event. Instead, process events in batches, collect the updates inside a WriteBatch, and apply the batch atomically. This minimizes CGo bridge crossing overhead and serializes disk writes.
Here is a Go consumer worker that reads event blocks, aggregates state, and writes the results to RocksDB.
Durability and the Changelog Reconstitution Pattern
A common concern with local state stores is pod ephemerality. If a Kubernetes pod dies, its local storage is typically lost. Restoring state from scratch by re-consuming the primary event stream would take hours, if not days, causing unacceptable recovery times.
To solve this, we implement the Changelog Pattern.
For every state update, the processor writes the mutation to a log-compacted Kafka topic (the changelog) before updating the local RocksDB. Log compaction ensures that Kafka retains only the latest value for each key, keeping the topic size small.
When a pod restarts or a partition is reassigned:
- The worker queries Kafka to locate the beginning offset ($0$) and the end watermark (latest offset) of the changelog topic for its assigned partition.
- The consumer suspends processing of the main input topic.
- The worker reads the changelog from offset $0$ to the end watermark, writing every key-value pair directly into RocksDB.
- Once the recovery loop reaches the watermark, the worker opens RocksDB for normal operations and begins consuming from the primary input topic.
Monitoring RocksDB: Metrics That Matter
Operating RocksDB blindly in production will inevitably lead to write stalls. Write stalls occur when RocksDB cannot write to disk fast enough to keep up with incoming streams. This typically happens when Level 0 files accumulate faster than background compaction threads can merge them.
To debug write stalls, memory leaks, and disk saturation, you must track key internal metrics and export them to Prometheus.
The Go snippet below shows how to parse internal statistics from RocksDB and export them to a Prometheus collector registry.
Kubernetes Deployment and Disk I/O Tuning
RocksDB relies heavily on high-speed disk I/O. If you deploy your container using standard cloud network storage (such as AWS EBS gp2 or gp3 volumes), network contention will degrade throughput. Compaction threads will fall behind, triggering write stalls.
For high-throughput workloads, always use local, physically attached NVMe SSDs. On AWS, deploy your workers on storage-optimized instances (such as the i3en or im4gn families). Mount the instance storage disk directly into the container using a Kubernetes hostPath or a dedicated Local Persistent Volume.
The Kubernetes manifest below mounts a physical NVMe drive and increases the system file descriptor limits (ulimit -n). RocksDB opens thousands of SST files simultaneously, making high descriptor limits essential.
# // snippet-5
apiVersion: apps/v1
kind: Deployment
metadata:
  name: stateful-event-processor
  labels:
    app: stateful-event-processor
spec:
  replicas: 3
  selector:
    matchLabels:
      app: stateful-event-processor
  template:
    metadata:
      labels:
        app: stateful-event-processor
    spec:
      containers:
      - name: processor
        image: stateful-event-processor:v2.1.0
        env:
        - name: ROCKSDB_PATH
          value: "/data/rocksdb"
        - name: OFF_HEAP_MEM_LIMIT
          value: "4294967296" # 4GB Off-Heap limit for RocksDB options configuration
        resources:
          limits:
            cpu: "4"
            memory: "6Gi" # Must exceed off-heap limit + runtime app usage (e.g. 4GB + 2GB Go runtime)
          requests:
            cpu: "2"
            memory: "4Gi"
        volumeMounts:
        - name: local-nvme-storage
          mountPath: /data
        securityContext:
          capabilities:
            add: ["SYS_RESOURCE"] # Allows the container to raise file limit structures if needed
      initContainers:
      - name: init-sysctl
        image: busybox
        command: ["sysctl", "-w", "fs.file-max=2097152"]
        securityContext:
          privileged: true
      volumes:
      - name: local-nvme-storage
        hostPath:
          path: /mnt/disks/nvme0n1 # Direct mount of host NVMe device
          type: DirectoryOrCreate
Graceful Shutdown and Compaction Tuning
When updating deployments or rolling pods, shutting down without flushing RocksDB state will corrupt local files, forcing long recovery cycles on pod startup.
During shutdown, your application must catch OS signals, stop the Kafka consumer, flush the active MemTables to disk, trigger a manual compaction range to clean up accumulated tombstones, and finally close the database handles.
Production Pitfalls to Avoid
If you deploy this architecture, keep these three operational details in mind:
1. The CGo Allocation Leak
In Go, gorocksdb uses CGo to communicate with the RocksDB C++ library. CGo allocations are invisible to the Go garbage collector. If you forget to call .Destroy() or .Free() on objects returned by RocksDB (such as Iterator, ReadOptions, WriteBatch, or Slice), memory will leak off-heap. Monitor your container’s memory usage using container_memory_working_set_bytes alongside Go’s GoMemstats to verify that memory consumption stabilizes over time.
2. File Descriptor Exhaustion
Each level of the RocksDB LSM tree contains hundreds of SST files. To query them quickly, RocksDB keeps file handles open. If you do not configure your host file limits, RocksDB will crash with an Unable to open file error. Always set SetMaxOpenFiles(-1), which configures RocksDB to open all data files, and ensure your system limit (ulimit -n) is set to at least 65535.
3. Compaction Pressure and IOPS Saturation
If your system experiences write bursts, RocksDB will write SST files to Level 0 faster than compaction threads can merge them. This can cause write stalls, which manifest as latency spikes in your Kafka consumer loop. Monitor rocksdb.write_stall_seconds_total. If stalls increase, increase the number of background compaction threads (opts.SetMaxBackgroundCompactions) or configure a rate limiter to throttle writes during spikes.