eBPF for Production Observability: Zero-Instrumentation Tracing
How to use eBPF to get deep production traces, metrics, and network visibility across any language stack without touching application code.
Your monitoring tells you p99 latency spiked to 800ms. Your Prometheus metrics show nothing obvious — CPU is fine, memory is stable, the service reports healthy. The distributed trace from your OpenTelemetry SDK covers 60% of the request path because the Python service three hops away was deployed six months ago by a team that’s since been reorganized, and nobody instrumented it. You add a log statement, redeploy, wait for the next incident. This is the observability tax you pay when your visibility is tied to the application code itself: blind spots wherever instrumentation was skipped, missed, or intentionally omitted. eBPF eliminates that contract. It attaches directly to the kernel and observes every syscall, every network packet, every function call — across every language and runtime — without touching a single line of application code.
What eBPF Actually Is (and Is Not)
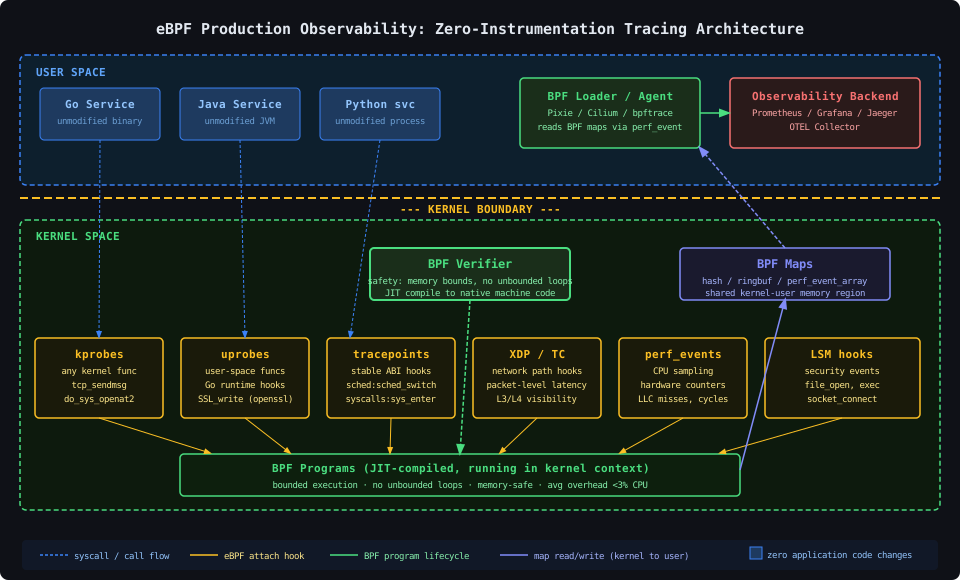
eBPF (extended Berkeley Packet Filter) is a kernel subsystem that lets you load and run sandboxed programs inside the Linux kernel without modifying kernel source or loading a kernel module. You write a small C-like program, compile it to BPF bytecode, and the kernel’s verifier checks it for safety — no unbounded loops, no memory access outside allowed regions, bounded stack usage — before JIT-compiling it to native machine code and attaching it to a hook point. The program then runs in kernel context on every event that fires that hook.
The hooks are the important part. You can attach to:
- kprobes/kretprobes: any kernel function entry or exit.
tcp_sendmsg,do_sys_openat2,inet_csk_accept— anything. - uprobes/uretprobes: any user-space function in any binary, by symbol name or offset. The Go runtime’s
runtime.newproc, OpenSSL’sSSL_write, the JVM’s GC functions. - tracepoints: stable, documented kernel hook points with a guaranteed ABI.
sched:sched_switch,net:net_dev_queue,syscalls:sys_enter_read. - XDP/TC: network hooks at the earliest point in the receive path, before the kernel network stack.
- LSM hooks: Linux Security Module integration points for every security-sensitive operation.
- perf_events: CPU cycle sampling, hardware performance counters (LLC misses, branch mispredictions, instruction counts).
The verifier is what makes this safe in production. A malformed BPF program doesn’t panic the kernel — it’s rejected at load time. Average overhead for typical observability programs is under 3% CPU. Compare that to a JVM agent with bytecode instrumentation running at 5-15% overhead, or a full APM SDK adding 8ms to every HTTP span.
The Toolchain Landscape
You need to pick the right tool for the job. The ecosystem has fragmented into three tiers:
Low-level scripting — bpftrace is the strace/awk of eBPF. Single-line probes or short scripts. No compilation step. Ideal for ad-hoc production debugging.
Library-based — BCC (BPF Compiler Collection) provides Python/Lua bindings that compile BPF C at runtime using LLVM. Higher overhead at load time (LLVM is big), but very flexible. The standard execsnoop, tcpconnect, biolatency tools ship with BCC.
CO-RE / libbpf — Compile Once, Run Everywhere. Write your BPF program in C with vmlinux.h BTF type information, compile to a portable object, run on any kernel 5.8+ without recompilation. This is the production-grade approach. Tools like Cilium, Pixie, and Tetragon use this.
High-level platforms — Pixie deploys a DaemonSet, auto-instruments all pods, and gives you Kubernetes-aware traces for HTTP/1, HTTP/2, gRPC, Postgres, Redis, MySQL, Cassandra, DNS — all via eBPF uprobes, no SDK changes needed. Cilium does the same at L3/L4 for network policy enforcement and flow visibility.
For kernel version requirements: basic kprobes work from kernel 4.1+. BTF (needed for CO-RE) requires 5.2+. Ring buffers (much more efficient than perf_event_array) require 5.8+. For a production fleet, target kernel 5.15 LTS minimum, which gives you the full modern eBPF feature set.
Ad-hoc Production Debugging with bpftrace
The fastest path to insight during an incident. No deployment, no restart, attaches in under 100ms:
These run live against production processes. Ctrl-C to detach. Zero permanent side effects.
Production CO-RE Programs with libbpf
For permanent observability infrastructure, you want a compiled, portable BPF program with a proper user-space consumer. Here’s a minimal but production-realistic pattern that tracks write syscall latency for a specific service:
The user-space consumer reads from the ring buffer and emits Prometheus metrics or OTEL spans. The ring buffer is lock-free and single-producer/single-consumer per CPU, which is why it replaced perf_event_array as the preferred event channel in modern BPF programs.
Tracing Encrypted Traffic: The SSL/TLS Uprobe Pattern
This is where eBPF genuinely has no competition. Distributed traces that terminate at TLS are blind to application-layer payloads. Sniffing at the NIC gives you encrypted bytes. But if you uprobe SSL_write and SSL_read in libssl or BoringSSL before encryption, you see plaintext — without certificate manipulation, without a proxy, without a service mesh sidecar:
Pixie’s HTTP/2 and gRPC tracing works exactly this way — it uprobe-intercepts the TLS library in the target process. The same technique works for BoringSSL (used by Go’s crypto/tls via CGo in some builds), GnuTLS, and NSS.
Kubernetes-Native Network Observability with Cilium Hubble
Running this manually at scale across a Kubernetes cluster is operationally painful. Cilium Hubble solves this: it’s a full network observability platform built on eBPF that gives you L3-L7 flow visibility, DNS query logging, and HTTP metrics for every pod-to-pod connection without any application changes.
This gives you a real-time, filterable view of every L7 flow in your cluster. HTTP status codes, latency, drop reasons — all derived from eBPF, zero SDK required.
Continuous Profiling with Parca
For continuous profiling in production, eBPF-based profilers like parca-agent use perf_events to sample stack traces at 99Hz across all processes simultaneously:
parca-agent uses DWARF unwinding and Go-specific frame pointer unwinding to reconstruct stack traces for compiled Go binaries without debug symbols. You get flamegraphs across your entire fleet at a flat ~2% overhead per node, compared to ~15% if you ran pprof on every pod.
What Actually Goes Wrong in Production
Verifier rejections from kernel version skew: A BPF program compiled against kernel 5.15 BTF headers may fail the verifier on kernel 5.10 nodes because certain helper functions or map types weren’t available. Fix: pin minimum kernel versions in your node pool and use bpftool feature probe to audit what’s available.
Ring buffer overflow at high event rates: At 100K events/second, a 256KB ring buffer fills in ~2ms if the consumer stalls. You’ll lose events silently unless you add a lost_events counter. Always size your ring buffer with max_events_per_sec * avg_event_size * 10ms_headroom. For a high-frequency syscall tracer, 4MB to 16MB ring buffers are not unusual.
uprobe offset drift after library updates: When OpenSSL updates from 3.0.7 to 3.0.8, symbol offsets change. If you’re attaching by address rather than symbol name, you silently trace nothing. Always attach by symbol name via BTF or procfs /proc/<pid>/maps + ELF symbol resolution. Pixie handles this by re-enumerating symbols on container restart.
Go stack scanning pre-1.17: Pre-Go 1.17, the Go runtime used a non-standard calling convention and didn’t maintain frame pointers, which breaks eBPF stack unwinding. Go 1.17+ added -framepointer by default. If you’re still running Go 1.16 services, your flamegraphs will show incomplete stacks.
Capabilities vs. root: Modern kernels (5.8+) split eBPF permissions across CAP_BPF, CAP_PERFMON, and CAP_NET_ADMIN. You don’t need full root for observability programs. Lock down your DaemonSet securityContext to exactly the capabilities needed and document them.
Connecting eBPF Events to Your Existing Stack
Raw eBPF events are useful for debugging but not for long-term storage or dashboards. The practical integration pattern:
- BPF program emits events to a ring buffer (kernel)
- User-space daemon (Go/Rust) polls the ring buffer, batches events
- Output: OTEL spans to your collector, Prometheus metrics via
/metrics, or raw logs to stdout for your log shipper
For traces specifically, correlating eBPF-observed syscall latency with existing OTEL trace IDs requires reading the trace ID from HTTP headers inside the BPF program via bpf_probe_read_user on the HTTP request buffer. Pixie and Groundcover handle this automatically for HTTP/1 and gRPC. For HTTP/2 with HPACK compression you need the full HPACK decoder in the user-space agent.
The simpler integration: use Hubble metrics in Prometheus, tag them by namespace and workload, and join them in Grafana against your existing APM data using the source_workload / destination_workload labels. You get service-level RED metrics (Rate, Errors, Duration) for every service pair without touching any service code. That’s the 80% solution that takes a day to deploy, not a quarter.
The Operational Verdict
eBPF-based observability is production-ready. The kernel requirements are reasonable — kernel 5.15 LTS is over two years old and available in every major Linux distribution and cloud provider’s managed node pools. The tooling (Cilium Hubble, Pixie, Parca, Tetragon) is stable and commercially supported. The overhead is measurably lower than SDK-based APM at comparable coverage depth.
The argument for adopting it isn’t that you throw away your existing OpenTelemetry instrumentation — keep it, it’s valuable for business-logic context that the kernel can’t see. The argument is that eBPF fills the gaps that SDK instrumentation always leaves: the uninstrumented service someone else owns, the encrypted traffic your proxy can’t inspect, the kernel-level latency that looks like application slowness, the third-party library you can’t modify. Those gaps are where hard incidents live. Close them at the kernel layer.