Detecting File Descriptor Exhaustion in gRPC Servers Using eBPF and OpenTelemetry Metrics
Detect and prevent gRPC server outages caused by silent file descriptor exhaustion using eBPF and OpenTelemetry metrics.
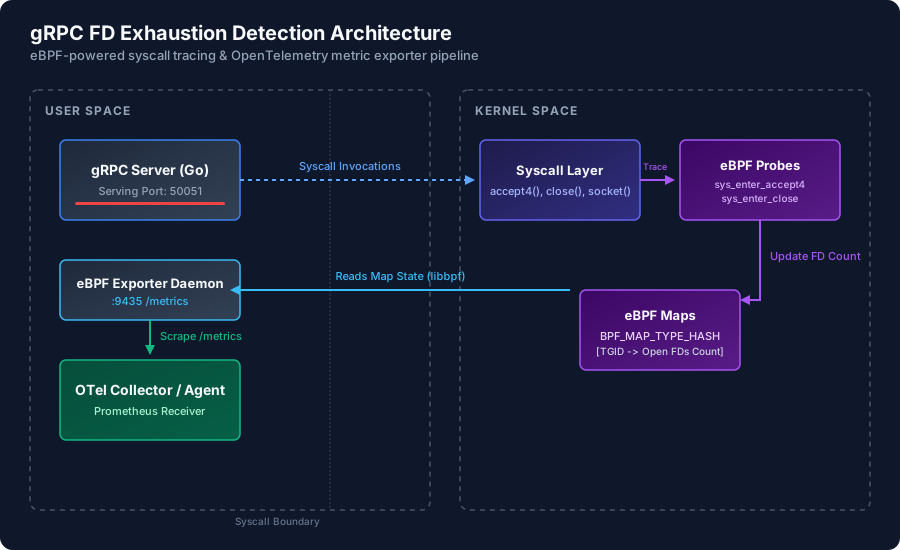
It is 3 AM. A critical downstream service drops off the radar. Health checks pass because they run over a local loopback or use simple in-memory liveness checks, but the service rejects all external gRPC connections with accept4: too many open files errors. The CPU usage is near zero, memory is stable, yet the server is functionally dead. This is the classic, silent failure mode of file descriptor (FD) exhaustion, exacerbated by gRPC’s multiplexing under HTTP/2. When a gRPC server runs out of file descriptors, it cannot accept new TCP sockets, failing silently while existing connections might persist, rendering traditional health checks deceptive. This post details how to detect and trace file descriptor exhaustion using eBPF and instrumenting it with OpenTelemetry metrics for real-time alerting before your server crashes.
The 3 AM Silent Outage: Anatomy of a gRPC FD Leak
In production systems, file descriptor exhaustion is one of the most frustrating failure modes to debug. Unlike out-of-memory (OOM) kills, which generate clear kernel logs in /var/log/kern.log and terminate the offending process, FD exhaustion is a slow, quiet decay. The process remains running, but it enters a state of partial availability:
- Existing connections continue to work: Since the sockets for active connections are already allocated, existing clients can communicate normally.
- Health checks report green: If health checks are served over a pre-established connection or run in-process without allocating new sockets, they return success.
- New connections are rejected: The moment a new client attempts to connect, the
accept4system call fails withEMFILE(Too many open files).
For gRPC services, which rely heavily on persistent TCP connections multiplexed via HTTP/2, this creates a bizarre failure pattern. A subset of clients (those with long-lived connections) experience zero issues, while new clients or clients that recently disconnected due to network blips cannot connect, facing persistent timeouts or connection refused errors.
Why gRPC and HTTP/2 Accelerate FD Exhaustion
To understand why gRPC applications are uniquely vulnerable to file descriptor leaks, we must look at how connection lifecycle management is handled.
gRPC uses HTTP/2 as its transport protocol. Unlike HTTP/1.1, where client connections are frequently closed or kept open in small pools, HTTP/2 multiplexes multiple logical streams over a single long-lived TCP connection. Under normal operating conditions, this significantly reduces the number of file descriptors used, as thousands of RPC calls can share one socket.
However, this design creates a dangerous vulnerability when client-side channels are mismanaged. A common anti-pattern among developers transitioning to gRPC is the creation of a new gRPC client channel (grpc.ClientConn in Go or Channel in Java) for every outgoing request instead of reusing a single shared channel.
When BadPracticeLeakChannel is invoked under high concurrency, the application tries to establish hundreds of new TCP connections per second. Each connection allocates a new socket file descriptor. If these connections are not closed explicitly, or if they enter the kernel’s TIME_WAIT state, the number of open file descriptors quickly rises.
Additionally, internal components like DNS resolvers, metrics exporters, database client pools, and log file handles all consume FDs. When a containerized gRPC application reaches its soft limit (typically 1024 inside default Docker containers), it halts.
The Limits of Legacy Monitoring: Why /proc is Too Slow
Traditionally, monitoring file descriptors involves polling the proc filesystem:
- Listing the contents of
/proc/self/fd/or/proc/<pid>/fd/. - Parsing
/proc/sys/fs/file-nrto get system-wide allocations. - Running
lsof -p <pid>in utility scripts.
While this approach works for slow leaks, it is fundamentally flawed for high-throughput microservices:
- High CPU Overhead: Parsing
/proc/<pid>/fd/requires a directory listing (readdirsystem call) which scales $O(N)$ with the number of open descriptors. When a process has 50,000 open file descriptors, scanning this directory every 10 seconds imposes severe CPU overhead and latency spikes on the application thread. - Resolution and Latency: Monitoring agents scrape metrics every 10, 15, or 30 seconds. A socket leak caused by a sudden traffic surge or infinite reconnect loops can exhaust 1,024 file descriptors in less than 2 seconds. The service will crash and restart (or hang) between scrapes, leaving zero trace in your metric graphs.
- Security Restrictions: Hardened containers often restrict access to
/procor run with reduced capabilities, preventing sidecar collectors from accessing process details.
We need a method that is event-driven, incurs negligible overhead, operates entirely inside the kernel, and updates counters immediately when an FD is allocated or released. That is where eBPF comes in.
The Event-Driven Solution: Tracking FD Lifecycle with eBPF
Extended Berkeley Packet Filter (eBPF) allows us to run sandboxed code directly inside the Linux kernel without modifying the kernel source or loading kernel modules. By hooking into system calls responsible for creating and destroying file descriptors, we can track allocations in real-time.
Specifically, we want to trace:
sys_exit_accept4: Triggered when an incoming TCP connection socket is successfully created.sys_exit_socket: Triggered when an outgoing socket is created.sys_enter_close: Triggered when a file descriptor is closed.
By tracking these entry and exit points, we can maintain an in-kernel map representing the count of open FDs for each running process.
Building the eBPF Tracing Program in C
We can write a CO-RE (Compile Once, Run Everywhere) eBPF program in C. This program uses tracepoints, which are stable kernel hooks, ensuring compatibility across different kernel versions.
This C code exposes a map called fd_count_map. Every time a connection is established (via accept4) or a socket is created, we increment the map value for that process. When a connection is closed, we decrement the value.
Loading the Probes and Querying Maps with Go
To run this eBPF program, we need a userspace agent to load the ELF binary into the kernel, attach the tracepoints, and read the map values. The standard toolchain for this in Go is Cilium’s ebpf package.
The Go loader initializes the eBPF maps and hooks the compiled C bytecode into the tracepoints. Because map lookups are key-value reads, fetching this metric takes $O(1)$ constant time, bypassing the expensive directory scan of /proc.
Exposing eBPF Metrics with OpenTelemetry
Once the eBPF metric is accessible in Go, we can export it via the OpenTelemetry (OTel) Metrics API. We use an asynchronous observable gauge. This type of metric is perfect for gauges where the value is pulled on-demand during a collection cycle rather than being pushed continuously.
The OTel metric pipeline now pulls the active socket counts directly from the kernel memory space whenever the OTel collector scrapes the endpoint.
Aggregation and Alerting: OTel Collector & Prometheus
To ingest these metrics, we routing them through an OpenTelemetry Collector. Below is a production configuration that sets up an OTLP receiver to accept metrics from the Go service and exports them to Prometheus format.
# snippet-5
receivers:
  otlp:
    protocols:
      grpc:
        endpoint: 0.0.0.0:4317
      http:
        endpoint: 0.0.0.0:4318
  prometheus:
    config:
      scrape_configs:
        - job_name: 'ebpf-grpc-services'
          scrape_interval: 10s
          static_configs:
            - targets: ['localhost:9435']

processors:
  batch:
    send_batch_size: 1024
    timeout: 5s
    send_batch_max_size: 2048

exporters:
  prometheus:
    endpoint: "0.0.0.0:8889"
    namespace: "otel"
  logging:
    verbosity: normal

service:
  pipelines:
    metrics:
      receivers: [otlp, prometheus]
      processors: [batch]
      exporters: [prometheus, logging]
  telemetry:
    logs:
      level: "info"
Once the OTel collector forwards metrics to Prometheus, we can define alerting rules. Instead of alerting only when the service reaches 90% of its hard limit (which might be too late), we use a predictive alert using Prometheus’s predict_linear function.
# snippet-6
groups:
  - name: grpc-fd-exhaustion-alerts
    rules:
      - alert: gRPCFileDescriptorExhaustionCritical
        expr: otel_process_grpc_active_ebpf_fds / process_max_fds > 0.85
        for: 2m
        labels:
          severity: critical
          team: platform-reliability
        annotations:
          summary: "Critical FD exhaustion on "
          description: "Process  open file descriptors has exceeded 85% of the limit (current value: )."

      - alert: gRPCFileDescriptorExhaustionPredictive
        expr: predict_linear(otel_process_grpc_active_ebpf_fds[10m], 900) >= process_max_fds
        for: 5m
        labels:
          severity: warning
          team: platform-reliability
        annotations:
          summary: "Predicted FD exhaustion on "
          description: "Based on the consumption rate over the last 10 minutes, process  will run out of file descriptors within 15 minutes."
The predictive rule calculates the slope of FD consumption over the last 10 minutes. If the line trends to cross the hard limit (process_max_fds) within 15 minutes (900 seconds), it fires an alert. This gives on-call engineers 15 minutes to act before service disruption occurs.
Real-Time Debugging with bpftrace
If you need to debug a running container in production to verify a leak before altering application configurations, you can run a simple bpftrace script. This provides instant visibility into syscall patterns:
# snippet-7
# Real-time inspection of accept4 and close syscalls per PID using bpftrace
sudo bpftrace -e '
tracepoint:syscalls:sys_exit_accept4 /pid == $1/ {
    @fds[pid] = count();
    printf("accept4: New socket opened. FD=%d, Process=%s (%d)\n", args->ret, comm, pid);
}
tracepoint:syscalls:sys_enter_close /pid == $1 && args->fd >= 0/ {
    printf("close: Closing FD=%d, Process=%s (%d)\n", args->fd, comm, pid);
}'
Pass the PID of your running gRPC server to the script (sudo ./trace.sh <PID>). If you see a stream of accept4 printouts without corresponding close calls, you have verified a connection leak in real-time.
Hardening and Mitigation: Production Keepalive Tuning
Detecting the problem is only half the battle. To secure your gRPC servers against socket-related outages, ensure your keepalive settings are configured to prune dead and leaking connections proactively.
A typical production configuration should include:
- MaxConnectionIdle: Set a limit on how long a connection can remain idle. This ensures that unused connections are automatically reaped.
- MaxConnectionAge: Force clients to reconnect after a duration (e.g., 1 hour). This prevents single sockets from living forever and helps distribute connections evenly across replica instances.
- Keepalive Time & Timeout: Send HTTP/2 pings to check if the client is still alive. If the client does not respond within the timeout, close the socket.
By combining low-overhead eBPF monitoring, predictive alerting with OpenTelemetry, and strict gRPC connection configurations, you can eliminate silent file descriptor outages entirely.