Designing a Tech Debt Paydown Framework: Mapping Cyclomatic Complexity to Customer-Facing SLIs
Stop refactoring code based on developer vibes. Learn how to build an automated framework mapping AST complexity to production customer SLIs.
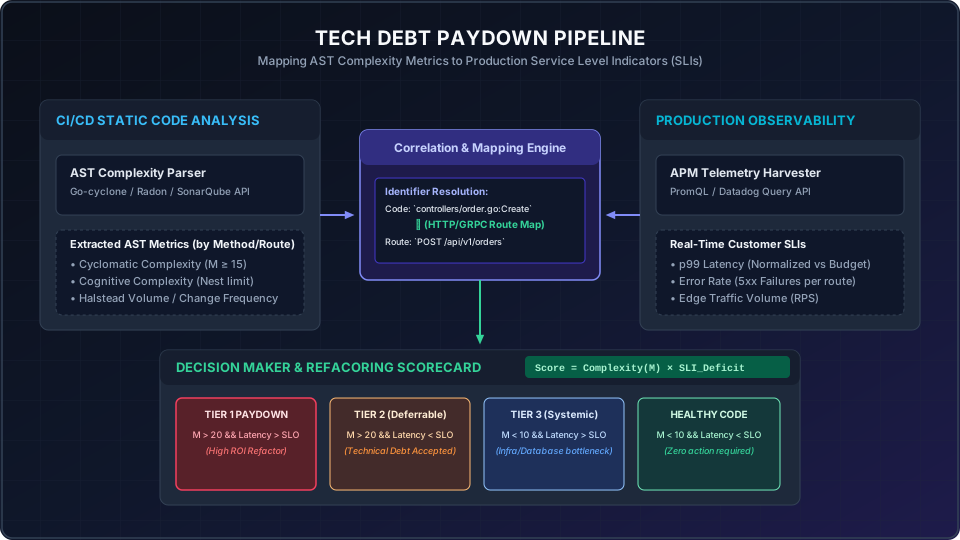
During a high-traffic sales event, your checkout service’s p99 latency spikes from a baseline of 180 milliseconds to 2.4 seconds, causing cascading thread pool exhaustion across downstream payment microservices and dropping 8% of customer carts. When the post-mortem begins, the engineering team immediately points to the /checkout/submit controller, labeling it an unmaintainable “spaghetti monster” that requires a complete top-down rewrite. But when you ask for a quantitative justification to present to business stakeholders—who are pushing for a new subscription feature—the discussion devolves into vague claims about “developer velocity” and “code smells.” The reality is that legacy codebases are filled with highly complex paths, but refactoring them blindly based on developer irritation is a recipe for wasted engineering hours. To fix this, you must construct a feedback loop that parses your codebase’s Abstract Syntax Tree (AST), extracts static complexity metrics, correlates them with production Service Level Indicators (SLIs), and scores each route to prioritize tech debt paydown with mathematical precision.
The Fallacy of Isolated Code Metrics
For decades, engineering teams have relied on static analysis metrics to evaluate code quality. Tools like SonarQube, Radon, or Go-cyclone run inside CI pipelines, calculating metrics such as McCabe’s Cyclomatic Complexity or Cognitive Complexity. The formulas are mathematically sound. For instance, Cyclomatic Complexity is defined as:
\[M = E - V + 2P\]Where:
- $E$ represents the number of edges in the control flow graph.
- $V$ represents the number of vertices (nodes) in the graph.
- $P$ represents the number of connected components (typically $P=1$ for a single function).
When a function’s complexity score exceeds a arbitrary threshold (e.g., $M > 15$), the CI linter throws a warning or fails the build.
However, relying solely on static metrics creates a critical blind spot: it completely ignores runtime context. A helper function that formats CSV reports for an internal, once-a-week administrative cron job might have a cyclomatic complexity of 45 due to nested switch statements parsing legacy data formats. Refactoring this function yields practically zero business value because it runs off-peak, doesn’t impact user-facing flows, and is rarely modified.
Conversely, a critical authentication function on your API gateway might have a cyclomatic complexity of only 12, but because it sits on the critical path of 10,000 requests per second (RPS), any latent inefficiency, unoptimized locks, or poorly handled conditional branches will execute millions of times per hour.
If your platform engineering team prioritizes tech debt based purely on static linter outputs, you will waste valuable sprint cycles refactoring low-risk code while leaving ticking production time-bombs untouched. To build an effective framework, you must correlate static code structure with production telemetry.
Building the Static Analysis and Telemetry Harvesters
The framework requires two data gathering components: a static code parser that runs on every master merge, and a telemetry harvester that regularly queries your APM or Prometheus instance.
1. The Static Code Parser (AST Analysis)
Instead of relying on commercial static analysis platforms that hide their metrics behind proprietary APIs, you can write a lightweight AST parser tailored to your language of choice. Let’s look at how to build an AST-based cyclomatic complexity analyzer in Go using the standard go/ast and go/parser libraries.
This parser scans your source code, identifies every function declaration, computes its cyclomatic complexity, and outputs the result mapped to the specific file and line number.
package main

import (
	"fmt"
	"go/ast"
	"go/parser"
	"go/token"
	"os"
	"path/filepath"
)

// FuncMetrics stores the computed metrics for a given function
type FuncMetrics struct {
	Name                 string
	FilePath             string
	StartLine            int
	CyclomaticComplexity int
}

// AnalyzeFile parses a Go file and extracts cyclomatic complexity for all functions
func AnalyzeFile(path string) ([]FuncMetrics, error) {
	fset := token.NewFileSet()
	node, err := parser.ParseFile(fset, path, nil, parser.ParseComments)
	if err != nil {
		return nil, err
	}

	var metrics []FuncMetrics

	ast.Inspect(node, func(n ast.Node) bool {
		fn, ok := n.(*ast.FuncDecl)
		if !ok {
			return true // Keep traversing the AST
		}

		// Compute Cyclomatic Complexity: M = Decisions + 1
		complexity := 1
		ast.Inspect(fn.Body, func(child ast.Node) bool {
			switch x := child.(type) {
			case *ast.IfStmt, *ast.ForStmt, *ast.RangeStmt, *ast.CommClause, *ast.CaseClause:
				complexity++
			case *ast.BinaryExpr:
				// Logical AND/OR operators introduce branches in execution
				if x.Op == token.LAND || x.Op == token.LOR {
					complexity++
				}
			}
			return true
		})

		pos := fset.Position(fn.Pos())
		metrics = append(metrics, FuncMetrics{
			Name:                 fn.Name.Name,
			FilePath:             path,
			StartLine:            pos.Line,
			CyclomaticComplexity: complexity,
		})
		return false // Do not inspect nested functions separately to avoid double counting
	})

	return metrics, nil
}

func main() {
	var allMetrics []FuncMetrics
	err := filepath.Walk("./controllers", func(path string, info os.FileInfo, err error) error {
		if err != nil {
			return err
		}
		if !info.IsDir() && filepath.Ext(path) == ".go" {
			fileMetrics, err := AnalyzeFile(path)
			if err == nil {
				allMetrics = append(allMetrics, fileMetrics...)
			}
		}
		return nil
	})

	if err != nil {
		fmt.Printf("Error walking paths: %v\n", err)
		os.Exit(1)
	}

	for _, m := range allMetrics {
		fmt.Printf("Func: %s | File: %s:%d | Complexity: %d\n",
			m.Name, m.FilePath, m.StartLine, m.CyclomaticComplexity)
	}
}
2. The Telemetry Harvester
Your observability pipeline is the source of truth for runtime performance. You need to harvest the request volume (RPS), p99 latency, and error rates (5xx responses) for every external-facing HTTP or gRPC route.
If you are running Prometheus, you can fetch these metrics using PromQL queries via the Prometheus HTTP API. For example, to retrieve the average throughput (RPS) and p99 latency for each route over the last 14 days, you can run the following queries:
Throughput (RPS):
sum(rate(http_requests_total{status=~"2.."}[14d])) by (handler)
p99 Latency (seconds):
histogram_quantile(0.99, sum(rate(http_request_duration_seconds_bucket[14d])) by (le, handler))
If you are using Datadog, you can write a script utilizing the Datadog API client to fetch timeseries metrics for trace.http.request.hits and trace.http.request.duration.p99 grouped by resource_name.
Correlating Routes to Source Code Filepaths
The primary challenge in mapping cyclomatic complexity to customer SLIs is the structural gap between code and telemetry. Prometheus knows about HTTP handlers (e.g., POST /api/v1/orders), while your AST parser knows about package structures and code blocks (e.g., controllers/order.go:CreateOrder).
To link these two datasets, you must implement a reliable mapping layer. You have three primary strategies to solve this:
Option A: Static Route Reflection (Framework Level)
If you are using framework-based routing (such as Go’s chi or Node’s Express), your router setup contains programmatic mappings. You can write a bootstrap script that boots your application in “dry-run” mode, inspects the router’s registered endpoints, and uses reflection to output the route pattern alongside the runtime function name.
For instance, in Go, using the runtime package, you can retrieve the memory address and name of the handler function assigned to a route:
func printRoutes(r chi.Router) {
	walkFunc := func(method string, route string, handler http.Handler, middlewares ...func(http.Handler) http.Handler) error {
		funcName := runtime.FuncForPC(reflect.ValueOf(handler).Pointer()).Name()
		fmt.Printf("Route: %s %s -> Handled by: %s\n", method, route, funcName)
		return nil
	}
	if err := chi.Walk(r, walkFunc); err != nil {
		panic(err)
	}
}
This output mapping acts as the join table in your SQL metrics database.
Option B: OpenTelemetry Semantic Conventions
A cleaner and more modern approach is leveraging OpenTelemetry (OTel). OTel includes semantic conventions for code metadata. You can configure your HTTP/gRPC middleware to inject code path details directly into the distributed trace spans.
By utilizing the standard attributes code.filepath and code.function, your tracing backend (e.g., Jaeger, Honeycomb, Datadog) automatically correlates incoming HTTP routes with the exact line of code that processed them.
import (
	"go.opentelemetry.io/otel/attribute"
	semconv "go.opentelemetry.io/otel/semconv/v1.20.0"
	"go.opentelemetry.io/otel/trace"
)

func APIMiddleware(next http.Handler) http.Handler {
	return http.HandlerFunc(func(w http.ResponseWriter, r *http.Request) {
		span := trace.SpanFromContext(r.Context())

		// In a production middleware, these values are resolved from the router context
		span.SetAttributes(
			semconv.CodeFunctionKey.String("CreateOrder"),
			semconv.CodeFilepathKey.String("controllers/order.go"),
			attribute.String("http.route", r.URL.Path),
		)

		next.ServeHTTP(w, r)
	})
}
With this tracing data exported to a centralized database (such as a BigQuery or PostgreSQL sink), you can join execution timeseries with AST metrics.
The Mathematical Prioritization Engine
Once you have matched code complexity with production performance, you need a scoring algorithm that prioritizes the refactoring candidates. We want a formula that evaluates ROI based on three dimensions:
- Complexity Deficit: How hard is the code to read, test, and maintain?
- Traffic Multiplier: How frequently is this poor code executed?
- Customer Pain (SLI Deficit): How far is this code from meeting our performance contracts (SLOs)?
Let’s define the empirical formula for the Refactoring ROI Score ($S$) of a given route ($e$):
\[Score(e) = Complexity(e) \times Volume(e) \times \left( \max\left(0, \frac{Latency_{p99}(e) - SLO(e)}{SLO(e)}\right) + (w \times ErrorRate(e)) \right)\]Where:
- $Complexity(e)$ is the maximum Cyclomatic Complexity $M$ of the functions executed within the execution tree of route $e$.
- $Volume(e)$ is the normalized average Requests Per Second (RPS) over a 7-day window.
- $Latency_{p99}(e)$ is the actual p99 latency of the route.
- $SLO(e)$ is the Target p99 Latency Budget for that route (e.g., 200ms).
- $ErrorRate(e)$ is the percentage of HTTP responses returning a 5xx status code (expressed as a decimal, e.g., 0.05 for 5%).
- $w$ is a weight parameter (e.g., 10.0) reflecting the business impact of errors vs latency.
Database Schema Design
To calculate this in production, you can persist these metrics in a PostgreSQL instance. The schema consists of three tables representing static metrics, telemetry metrics, and the mapping join table.
-- Store codebase metrics harvested during CI/CD builds
CREATE TABLE codebase_complexity (
    id SERIAL PRIMARY KEY,
    file_path VARCHAR(512) NOT NULL,
    function_name VARCHAR(256) NOT NULL,
    cyclomatic_complexity INT NOT NULL,
    cognitive_complexity INT NOT NULL,
    lines_of_code INT NOT NULL,
    git_commit_sha CHAR(40) NOT NULL,
    collected_at TIMESTAMP DEFAULT CURRENT_TIMESTAMP
);

-- Store production metrics harvested from APM APIs
CREATE TABLE production_route_metrics (
    id SERIAL PRIMARY KEY,
    http_method VARCHAR(10) NOT NULL,
    route_pattern VARCHAR(256) NOT NULL,
    p99_latency_ms INT NOT NULL,
    target_slo_ms INT NOT NULL DEFAULT 200,
    error_rate_pct DECIMAL(5,2) NOT NULL,
    request_volume_rps INT NOT NULL,
    collected_at TIMESTAMP DEFAULT CURRENT_TIMESTAMP
);

-- Join table correlating source functions to HTTP routes
CREATE TABLE code_route_mapping (
    file_path VARCHAR(512) NOT NULL,
    function_name VARCHAR(256) NOT NULL,
    route_pattern VARCHAR(256) NOT NULL,
    PRIMARY KEY (file_path, function_name, route_pattern)
);
The Scoring Query
With the tables populated, you can execute a window function query that groups the tables, applies the prioritization formula, and ranks candidates:
WITH joined_metrics AS (
    SELECT
        cc.file_path,
        cc.function_name,
        crm.route_pattern,
        cc.cyclomatic_complexity,
        pm.p99_latency_ms,
        pm.target_slo_ms,
        pm.error_rate_pct,
        pm.request_volume_rps,
        -- Calculate Latency Deficit: (p99 - SLO) / SLO
        GREATEST(0, (pm.p99_latency_ms::float - pm.target_slo_ms::float) / pm.target_slo_ms::float) AS latency_deficit,
        -- Normalize error rate percentage to decimal
        (pm.error_rate_pct / 100.0) AS error_rate_decimal
    FROM codebase_complexity cc
    JOIN code_route_mapping crm ON cc.file_path = crm.file_path AND cc.function_name = crm.function_name
    JOIN production_route_metrics pm ON crm.route_pattern = pm.route_pattern
    WHERE cc.collected_at > NOW() - INTERVAL '1 day'
      AND pm.collected_at > NOW() - INTERVAL '1 day'
)
SELECT
    file_path,
    function_name,
    route_pattern,
    cyclomatic_complexity,
    request_volume_rps,
    p99_latency_ms,
    target_slo_ms,
    error_rate_pct,
    -- Formula: Complexity * Volume * (Latency_Deficit + 10 * Error_Rate)
    (cyclomatic_complexity * request_volume_rps * (latency_deficit + (10.0 * error_rate_decimal))) AS refactoring_roi_score
FROM joined_metrics
ORDER BY refactoring_roi_score DESC;
This query classifies your technical debt into four distinct quadrants, enabling you to isolate the true targets of engineering investment:
| Quadrant | Metrics Profile | Action Plan |
|---|---|---|
| Tier 1 (High Complexity, High SLI Deficit) | $M > 15$, $Latency > SLO$ | Immediate Refactor. Code is highly branched and degrading customer experience. High ROI. |
| Tier 2 (High Complexity, Safe SLI) | $M > 15$, $Latency < SLO$ | Accept Debt. Code is complex but performs well and handles traffic safely. Refactor only if changing. |
| Tier 3 (Low Complexity, Poor SLI) | $M < 10$, $Latency > SLO$ | Systems Audit. The code is clean. The bottleneck is likely slow DB queries, poor indexing, or I/O blockages. |
| Tier 4 (Low Complexity, Safe SLI) | $M < 10$, $Latency < SLO$ | Pristine State. Healthy codebase path. Requires zero engineering action. |
Automating the Feedback Loop: Linear/Jira Integration
To ensure the framework is adopted, it must not live in an isolated dashboard that engineers forget to check. You should automate ticket creation in Jira or Linear. By running a weekly cron job script, you can query your database, identify the worst-performing Tier 1 functions, and automatically inject tickets into the platform backlog.
Here is a Python script that pulls refactoring candidates from the metrics database, evaluates them, and creates tracking issues via a JIRA REST API call:
import os
import sys
import requests
import psycopg2

def fetch_top_refactor_candidates():
    db_url = os.getenv("DATABASE_URL")
    if not db_url:
        print("DATABASE_URL env variable is missing")
        sys.exit(1)

    conn = psycopg2.connect(db_url)
    cur = conn.cursor()

    # Query to fetch the top 3 critical refactoring targets
    query = """
        SELECT file_path, function_name, route_pattern, cyclomatic_complexity, p99_latency_ms, error_rate_pct, request_volume_rps,
               (cyclomatic_complexity * request_volume_rps * (GREATEST(0, (p99_latency_ms - 200.0) / 200.0) + (10.0 * (error_rate_pct / 100.0)))) AS roi_score
        FROM (
            SELECT cc.file_path, cc.function_name, crm.route_pattern, cc.cyclomatic_complexity, pm.p99_latency_ms, pm.error_rate_pct, pm.request_volume_rps
            FROM codebase_complexity cc
            JOIN code_route_mapping crm ON cc.file_path = crm.file_path AND cc.function_name = crm.function_name
            JOIN production_route_metrics pm ON crm.route_pattern = pm.route_pattern
            ORDER BY cc.collected_at DESC, pm.collected_at DESC
        ) sub
        WHERE cyclomatic_complexity > 15
        ORDER BY roi_score DESC
        LIMIT 3;
    """
    cur.execute(query)
    rows = cur.fetchall()
    cur.close()
    conn.close()
    return rows

def create_jira_ticket(candidate):
    file_path, func, route, complexity, p99, errors, rps, score = candidate

    jira_domain = os.getenv("JIRA_DOMAIN")  # e.g. company.atlassian.net
    api_token = os.getenv("JIRA_API_TOKEN")
    auth_email = os.getenv("JIRA_EMAIL")

    if not all([jira_domain, api_token, auth_email]):
        print("Jira authentication environment variables are missing")
        return

    url = f"https://{jira_domain}/rest/api/3/issue"
    headers = {
        "Accept": "application/json",
        "Content-Type": "application/json"
    }

    description_text = (
        f"Automated Alert: High-priority technical debt paydown opportunity identified.\n\n"
        f"Function Details:\n"
        f"- Target: `{func}` in `{file_path}`\n"
        f"- Mapped Route: `{route}`\n"
        f"- Runtime Throughput: {rps} RPS\n\n"
        f"Performance & Structure Metrics:\n"
        f"- Cyclomatic Complexity (M): {complexity} (Threshold: 15)\n"
        f"- Production p99 Latency: {p99}ms (SLO: 200ms)\n"
        f"- Production Error Rate: {errors}%\n"
        f"- Computed Priority Score: {score:.1f}\n\n"
        f"Recommendation:\n"
        f"The function complexity is creating conditional logic branches that negatively affect performance under load. "
        f"Break down `{func}` into smaller, isolated testable units and address underlying database or memory leaks."
    )

    payload = {
        "fields": {
            "project": {"key": "PLAT"},
            "summary": f"Refactor `{func}` in `{file_path}` (ROI Score: {score:.1f})",
            "description": {
                "type": "doc",
                "version": 1,
                "content": [
                    {
                        "type": "paragraph",
                        "content": [
                            {
                                "type": "text",
                                "text": description_text
                            }
                        ]
                    }
                ]
            },
            "issuetype": {"name": "Task"},
            "labels": ["tech-debt", "observability-derived"]
        }
    }

    response = requests.post(url, json=payload, headers=headers, auth=(auth_email, api_token))
    if response.status_code == 201:
        print(f"Successfully created JIRA issue for {func}")
    else:
        print(f"Failed to create JIRA issue: {response.status_code} - {response.text}")

if __name__ == "__main__":
    candidates = fetch_top_refactor_candidates()
    for cand in candidates:
        create_jira_ticket(cand)
Real-World Failure Modes & Mitigation
Designing this framework is not without challenges. When running this pipeline at scale, you are likely to encounter three distinct failure modes.
1. Dynamic Route Expansion & Cardinality Explosions
If your route mapping layer maps endpoints verbatim, dynamic parameters can pollute your telemetry table. For example, requests to /api/v1/users/102, /api/v1/users/403, and /api/v1/users/998 can generate hundreds of rows in production_route_metrics. This leads to a cardinality explosion in Prometheus and renders the route join query useless.
- Mitigation: Implement a sanitization engine in your router middleware or prometheus exporter. Map route strings to their structural definitions (e.g.,
/api/v1/users/:idor/api/v1/users/{user_id}) before exporting the metrics.
2. Utility Class and Helper Library Hell
Suppose you have a utility function utils.json.ParseNestedFields that has a cyclomatic complexity of 30 because it handles dozens of legacy data conversions. Because this function is called inside your core middleware, it is executed on every single route. A naive correlation pipeline will map this utility function to every HTTP endpoint, highlighting it as a Tier 1 bottleneck everywhere.
- Mitigation: The correlation engine must trace the execution path. Apply a filter that excludes generic utility classes from route calculations unless the complexity is concentrated inside a route-specific controller. Alternatively, compute the “PageRank” of the code dependencies. If a function’s incoming dependencies exceed a threshold (e.g., it is imported by >10 packages), label it as a library helper and evaluate it on a separate utility matrix rather than merging it directly into specific route scores.
3. Goodhart’s Law: Gaming the Complexity Score
As soon as engineering leadership starts tracking Refactoring ROI Scores as a KPI, engineers will optimize for the metric rather than the code. Developers will break down highly complex functions by arbitrarily slicing them into nested closures, local helpers, or abusing GOTO statements simply to drop the Cyclomatic Complexity score below the linter threshold. This decreases the metric while actively increasing cognitive load and making the codebase harder to debug.
- Mitigation: Do not rely on a single static metric. Combine Cyclomatic Complexity with Cognitive Complexity (which measures nested code depth and logic readability) and Code Churn (the frequency with which a file is modified in git history). A function with a cyclomatic complexity of 20 that hasn’t been changed in 18 months represents far less risk than a function with a complexity of 12 that is edited 45 times a sprint. The priority must be given to files that are actively changing and actively failing.