Designing a Quantitative Framework for Evaluating Developer Inner-Loop Latency and Local Environment Drift
A production-grade quantitative framework and telemetry system to instrument, measure, and eliminate developer inner-loop compile latency and local environment drift.
Imagine a backend engineer debugging a flaky integration test in a sprawling microservice ecosystem. They modify a single line of Go code, run the local build, and wait. The compile takes 18 seconds; the Docker image rebuild adds 42 seconds; the local PostgreSQL container’s migration hook takes 12 seconds to boot. That is 72 seconds of “inner-loop” latency for a single-line edit. Multiply this by 40 iterations a day across a 150-engineer organization, and you are bleeding over 700 hours of pure engineering capacity every week. More insidiously, during that 72-second window, the developer’s attention span wanders; they check Slack, look at email, or open a browser tab. The true cost is not just the 72 seconds of idle CPU cycles, but the cognitive recovery cost of context switching, which pushes focus recovery times up to 15 minutes per disruption. Concurrently, a subtle database version mismatch (local running PostgreSQL 14.8 vs. production running 16.3) causes a recursive query to execute instantly on their tiny, un-indexed dev database, only to lock up when it hits the production workload. This is the twin threat of developer inner-loop latency and local environment drift.
The Mathematics of the Developer Inner-Loop
To optimize the inner-loop, we must first build a formal mathematical model. We define the total inner-loop latency $L_{total}$ for a single development cycle as:
\[L_{total} = T_{change} + T_{compile} + T_{deploy} + T_{test} + T_{verify}\]Where:
- $T_{change}$ represents the human interaction time required to edit a file.
- $T_{compile}$ is the local incremental compilation and static analysis phase.
- $T_{deploy}$ is the local runtime instantiation phase (e.g., live-reloading a daemon, rebuilding local Docker containers, restarting hot-reload engines).
- $T_{test}$ is the execution of targeted unit, integration, or contract tests.
- $T_{verify}$ is the feedback loop display latency (e.g., printing test results, debugger attach latency).
We define $T_{system}$ as the machine-bound phase of the loop:
\[T_{system} = T_{compile} + T_{deploy} + T_{test} + T_{verify}\]Now, we introduce a probability function for cognitive decay and context switching. Human factors research indicates that if $T_{system}$ exceeds a certain threshold $T_{threshold}$ (empirically measured at approximately $8.0$ seconds), the probability of a developer context-switching $P(CS)$ rises exponentially. We can model this using a cumulative distribution function of an exponential distribution:
\[P(CS) = \begin{cases} 0 & \text{if } T_{system} \le T_{threshold} \\ 1 - e^{-\lambda (T_{system} - T_{threshold})} & \text{if } T_{system} > T_{threshold} \end{cases}\]Where $\lambda$ represents the cognitive decay coefficient. Based on internal observability data from large-scale organizations, we parameterize $\lambda \approx 0.08$. Under this parameterization, a 30-second system wait time yields a $P(CS) \approx 83\%$, while a 90-second wait time guarantees a context switch ($P(CS) \approx 99.8\%$).
Once a developer context-switches, they do not return to their code the millisecond the compilation completes. They read a Slack message, join a conversation, or read an article, introducing a focus recovery overhead $T_{recovery}$ which typically averages between $600$ and $900$ seconds (10 to 15 minutes).
Therefore, the expected productive time lost ($W_{lost}$) in seconds per cycle is:
\[E(W_{lost}) = T_{system} + P(CS) \cdot T_{recovery}\]For an engineering organization of size $N$ executing an average of $C$ cycles per day, the daily productive capability loss in hours ($H_{loss}$) is:
\[H_{loss} = \frac{N \cdot C \cdot \left[ T_{system} + \left(1 - e^{-\lambda (T_{system} - T_{threshold})}\right) \cdot T_{recovery} \right]}{3600}\]Let us plug in concrete numbers from a typical microservice engineering organization: $N = 100$ developers, $C = 30$ iterations/day, $T_{system} = 45$ seconds, $T_{threshold} = 8$ seconds, $\lambda = 0.08$, and $T_{recovery} = 600$ seconds.
\(P(CS) = 1 - e^{-0.08 \cdot (45 - 8)} = 1 - e^{-2.96} \approx 0.948 \quad (94.8\%)\) \(E(W_{lost}) = 45 + 0.948 \cdot 600 = 613.8 \text{ seconds (10.23 minutes) per cycle}\) \(H_{loss} = \frac{100 \cdot 30 \cdot 613.8}{3600} \approx 511.5 \text{ hours lost per day}\)
At a fully loaded engineering cost of $$100/\text{hour}$, this organization is losing $$51,150$ per day—or over $$1,000,000$ per month—solely due to compile, containerization, and local test run delays. By shrinking $T_{system}$ from 45 seconds down to 5 seconds (below the $T_{threshold}$), we drop $P(CS)$ to 0. The daily time loss drops from $511.5$ hours to just $4.1$ hours. The ROI on developer productivity tooling is not speculative; it is mathematically absolute.
Taxonomy of Local Environment Drift
While inner-loop latency burns time, local environment drift introduces silent bugs that bypass CI/CD and explode in production. We classify drift into four critical vectors:
- Toolchain and Runtime Drift: This occurs when the local compiler, runtime, or runtime manager versions differ from the official production specifications. For example, a developer running Go 1.20 locally while the production target is Go 1.22. In Go 1.22, the loop variable sharing behavior changed (
forloop variables are created per iteration rather than shared). Code that behaves correctly in the developer’s local testing environment may fail or leak goroutines in production because the runtime scheduling and compilation semantics have diverged. - Infrastructure and Dependency Drift: This manifests as mismatched database engines, differing minor library versions, or out-of-sync message broker configurations. A classic failure mode is a developer testing queries against PostgreSQL 14 locally when production uses PostgreSQL 16. The PostgreSQL 16 query planner is significantly more advanced; queries that utilize index-only scans on production might degrade to costly sequential scans on PostgreSQL 14, or vice versa, masking performance degradations until the code is deployed.
- Data Schema Drift: Local databases quickly become fragmented. Developers run migration scripts out of order, execute manual SQL statements to debug specific issues, or bypass schema migrations entirely. A developer might add an index manually to their local PostgreSQL instance to make a query performant, but fail to check that index into the migration framework (e.g., Atlas or Liquibase). The code passes local integration tests but causes severe performance degradation or deadlocks in staging and production due to missing indices under load.
- Configuration and Secrets Drift: Local configurations often bypass security, authentication, and validation layers to ease debugging. Flags like
DISABLE_JWT_VALIDATION=trueorBYPASS_OAUTH=truedrift local execution paths entirely away from production code paths. This results in critical authentication bugs or nil pointer dereferences when the system attempts to parse user claims that were mocked out or bypassed locally.
Architecture of a Telemetry-Driven Monitoring Agent
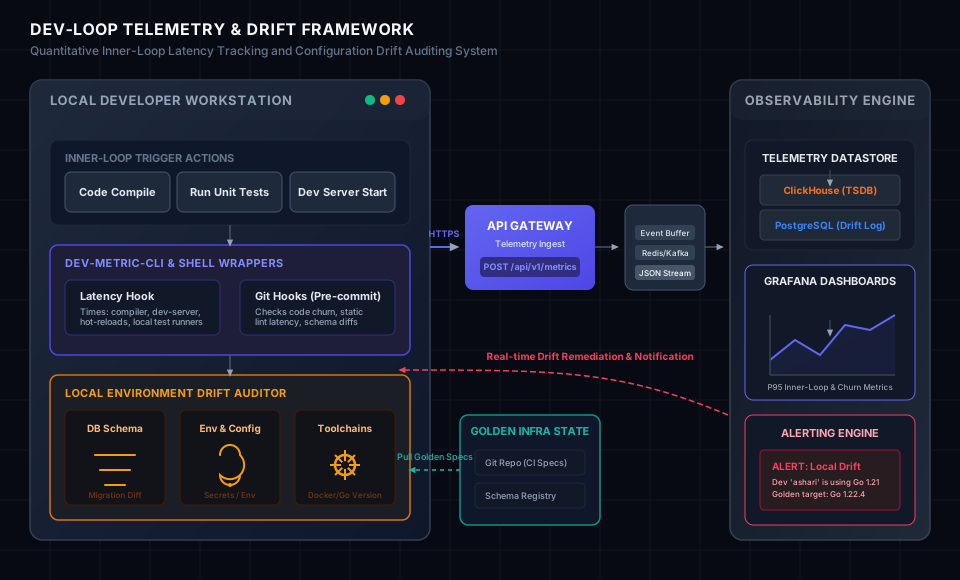
To combat these vectors, we must establish a quantitative telemetry framework. We cannot manage what we do not measure, but we cannot measure via manual time tracking. We must build non-invasive instrumentation wrappers around build tools, compilers, and test runners, feeding metrics into a central storage engine.
The first component is the wrapper. Instead of executing raw commands like go test or npm run test directly, the developer’s shell is configured with a wrapper script (compiled as a Go binary or a bash shell hook) that intercept these calls. Below is a production-grade Bash wrapper designed to sit inside a developer’s .bashrc or .zshrc to wrap the make utility, capturing metrics and shipping them asynchronously:
#!/usr/bin/env bash
# /usr/local/bin/make-telemetry-wrapper

# Capture base execution context
CMD_START=$(date +%s%N)
CMD_ARGS="$*"
GIT_BRANCH=$(git rev-parse --abbrev-ref HEAD 2>/dev/null || echo "detached")
GIT_COMMIT=$(git rev-parse --short HEAD 2>/dev/null || echo "unknown")
GIT_CHURN=$(git status --porcelain 2>/dev/null | wc -l || echo "0")

# Run the actual compile/build command
/usr/bin/make "$@"
EXIT_CODE=$?

CMD_END=$(date +%s%N)
DURATION_NS=$((CMD_END - CMD_START))
DURATION_MS=$((DURATION_NS / 1000000))

# Execute drift checks asynchronously to prevent blocking the developer
(
  # Verify local system resources
  SYS_CORES=$(nproc 2>/dev/null || sysctl -n hw.ncpu 2>/dev/null || echo "1")
  SYS_MEM_GB=$(free -g 2>/dev/null | awk '/^Mem:/{print $2}' || echo "0")

  # Audit Docker Engine and Runtime tools
  DOCKER_VER=$(docker --version 2>/dev/null | awk '{print $3}' | tr -d ',')
  GO_VER=$(go version 2>/dev/null | awk '{print $3}')

  # Construct telemetry JSON payload
  PAYLOAD=$(cat <<EOF
{
  "developer_uuid": "$(cat /etc/machine-id 2>/dev/null || echo "unknown-dev")",
  "repository": "$(basename "$(git rev-parse --show-toplevel 2>/dev/null || pwd)")",
  "branch": "${GIT_BRANCH}",
  "commit_hash": "${GIT_COMMIT}",
  "dirty_files": ${GIT_CHURN},
  "command": "make ${CMD_ARGS}",
  "duration_ms": ${DURATION_MS},
  "exit_code": ${EXIT_CODE},
  "cpu_cores": ${SYS_CORES},
  "system_memory_gb": ${SYS_MEM_GB},
  "toolchain_versions": {
    "docker": "${DOCKER_VER}",
    "go": "${GO_VER}"
  },
  "timestamp": "$(date -u +"%Y-%m-%dT%H:%M:%SZ")"
}
EOF
)

  # Ship payload to the local telemetry agent port or central ingress gateway
  # We set a tight timeout (200ms) to guarantee no local shell hang
  curl -s -X POST -H "Content-Type: application/json" \
       -d "${PAYLOAD}" \
       --max-time 0.2 \
       http://localhost:9092/api/v1/metrics >/dev/null 2>&1
) &

# Preserve original exit code
exit ${EXIT_CODE}
This wrapper performs its metric collection and system execution inline, but forks the telemetry serialization, hardware inspection, and remote shipping into a detached subshell ( ... ) &. This ensures that even if the central telemetry gateway is experiencing outages, the developer’s build pipeline suffers zero latency degradation.
Scalable Telemetry Ingestion and In-Memory Analytics
The collector gateway is built in Go, designed to handle high-throughput writes with minimal memory allocations. It exposes /api/v1/metrics and routes payloads straight to an in-memory ring-buffer that flushes batches to ClickHouse in parquet or JSONEachRow format.
Here is the Go HTTP handler implementing the write path:
package main

import (
	"context"
	"encoding/json"
	"net/http"
	"sync"
	"time"
)

type TelemetryPayload struct {
	DeveloperUUID    string            `json:"developer_uuid"`
	Repository       string            `json:"repository"`
	Branch           string            `json:"branch"`
	CommitHash       string            `json:"commit_hash"`
	DirtyFiles       int               `json:"dirty_files"`
	Command          string            `json:"command"`
	DurationMS       int64             `json:"duration_ms"`
	ExitCode         int               `json:"exit_code"`
	CPUCores         int               `json:"cpu_cores"`
	SystemMemoryGB   int               `json:"system_memory_gb"`
	ToolchainVersions map[string]string `json:"toolchain_versions"`
	Timestamp        string            `json:"timestamp"`
}

type TelemetryCollector struct {
	mu           sync.Mutex
	buffer       []TelemetryPayload
	flushSize    int
	flushInterval time.Duration
	writeChan    chan TelemetryPayload
}

func NewCollector(flushSize int, flushInterval time.Duration) *TelemetryCollector {
	tc := &TelemetryCollector{
		buffer:        make([]TelemetryPayload, 0, flushSize),
		flushSize:     flushSize,
		flushInterval: flushInterval,
		writeChan:     make(chan TelemetryPayload, 10000),
	}
	go tc.worker()
	return tc
}

func (tc *TelemetryCollector) ServeHTTP(w http.ResponseWriter, r *http.Request) {
	if r.Method != http.MethodPost {
		http.Error(w, "Method not allowed", http.StatusMethodNotAllowed)
		return
	}

	var payload TelemetryPayload
	if err := json.NewDecoder(r.Body).Decode(&payload); err != nil {
		http.Error(w, err.Error(), http.StatusBadRequest)
		return
	}

	select {
	case tc.writeChan <- payload:
		w.WriteHeader(http.StatusAccepted)
	default:
		// Queue full, drop telemetry to protect memory footprint
		w.WriteHeader(http.StatusServiceUnavailable)
	}
}

func (tc *TelemetryCollector) worker() {
	ticker := time.NewTicker(tc.flushInterval)
	defer ticker.Stop()

	for {
		select {
		case payload := <-tc.writeChan:
			tc.mu.Lock()
			tc.buffer = append(tc.buffer, payload)
			if len(tc.buffer) >= tc.flushSize {
				tc.flush()
			}
			tc.mu.Unlock()
		case <-ticker.C:
			tc.mu.Lock()
			if len(tc.buffer) > 0 {
				tc.flush()
			}
			tc.mu.Unlock()
		}
	}
}

func (tc *TelemetryCollector) flush() {
	// batchWriteToClickHouse encapsulates the bulk INSERT statement using ClickHouse native TCP client
	batchWriteToClickHouse(context.Background(), tc.buffer)
	// Clear slice while preserving capacity
	tc.buffer = tc.buffer[:0]
}

func batchWriteToClickHouse(ctx context.Context, data []TelemetryPayload) {
	// ...
}
To support real-time aggregation and technical leadership dashboards (e.g., tracking regression in Go compiler updates), we use the following ClickHouse DDL schema:
CREATE TABLE dev_loop_metrics (
    developer_uuid UUID,
    repository LowCardinality(String),
    branch String,
    commit_hash LowCardinality(String),
    dirty_files UInt16,
    command LowCardinality(String),
    duration_ms UInt64,
    exit_code UInt8,
    cpu_cores UInt8,
    system_memory_gb UInt8,
    toolchain_versions Map(String, String),
    timestamp DateTime64(3, 'UTC')
) ENGINE = MergeTree()
PARTITION BY toYYYYMM(timestamp)
ORDER BY (repository, command, timestamp);
Using this setup, a technical lead can query build performance metrics across the organization instantly. The following analytical query calculates the P50, P90, and P95 execution latencies alongside failure rates, grouping them by repository and compiler version to isolate regressions introduced by toolchain updates:
SELECT
    repository,
    toolchain_versions['go'] AS go_version,
    count() AS total_executions,
    quantile(0.50)(duration_ms) AS p50_duration_ms,
    quantile(0.90)(duration_ms) AS p90_duration_ms,
    quantile(0.95)(duration_ms) AS p95_duration_ms,
    round(100.0 * countIf(exit_code != 0) / count(), 2) AS failure_rate_percentage
FROM dev_loop_metrics
WHERE timestamp >= now() - INTERVAL 7 DAY
  AND command LIKE 'make%'
GROUP BY repository, go_version
ORDER BY repository, p95_duration_ms DESC;
Building a Quantitative Local Drift Audit Engine
Measuring latency is half the equation. We must also run active checks for environment drift. We define a composite Drift Scoring Index ($DS_i$) for a given developer workstation $i$ as:
\[DS_i = w_{runtime} \cdot I(runtime\_drift) + w_{schema} \cdot N(schema\_diffs) + w_{config} \cdot I(config\_drift)\]Where:
- $I(\text{condition})$ is an indicator function returning $1$ if the condition is met, and $0$ if not.
- $N(\text{schema_diffs})$ is the integer count of unapplied or conflicting database migrations.
- $w$ represents weighting coefficients derived from the operational risk of each drift vector:
- $w_{runtime} = 0.35$ (Medium risk; runtime incompatibilities can alter scheduling details).
- $w_{schema} = 0.45$ (High risk; missing indices or table columns crash queries under traffic load).
- $w_{config} = 0.20$ (Lower risk; local configs bypass services, but are easily corrected).
To calculate $DS_i$, a background CLI utility (dev-audit) runs pre-commit or pre-push. Let us inspect how it analyzes database schema drift. The auditor queries the local development database and compares its schema state against a “golden configuration” snapshot checked into the Git repository or pulled from a central migration registry.
Below is the core of the database schema drift check implemented in Go, verifying if any structural migrations are missing or modified locally:
package main

import (
	"database/sql"
	"fmt"
	"io/ioutil"
	"path/filepath"
	"sort"
	"strings"

	_ "github.com/lib/pq"
)

type MigrationState struct {
	Version string
	Dirty   bool
}

// CheckSchemaDrift connects to the local dev DB, reads applied migrations,
// and compares them against the local migration files in the repo.
func CheckSchemaDrift(dbConnStr string, migrationsDir string) (int, error) {
	db, err := sql.Open("postgres", dbConnStr)
	if err != nil {
		return 0, fmt.Errorf("failed to open database connection: %w", err)
	}
	defer db.Close()

	// Query applied migrations from schema history table
	rows, err := db.Query("SELECT version, dirty FROM schema_migrations ORDER BY version ASC")
	if err != nil {
		// If the table doesn't exist, all migrations are unapplied
		return 0, fmt.Errorf("failed to query schema_migrations table: %w", err)
	}
	defer rows.Close()

	appliedMigrations := make(map[string]MigrationState)
	for rows.Next() {
		var state MigrationState
		if err := rows.Scan(&state.Version, &state.Dirty); err != nil {
			return 0, err
		}
		appliedMigrations[state.Version] = state
	}

	// Read migration files in repository
	files, err := ioutil.ReadDir(migrationsDir)
	if err != nil {
		return 0, fmt.Errorf("failed to read migrations directory: %w", err)
	}

	var localMigrations []string
	for _, f := range files {
		if filepath.Ext(f.Name()) == ".sql" && strings.HasSuffix(f.Name(), ".up.sql") {
			// Extract version prefix (e.g., 20260723080000_add_users_table.up.sql -> 20260723080000)
			version := strings.Split(f.Name(), "_")[0]
			localMigrations = append(localMigrations, version)
		}
	}
	sort.Strings(localMigrations)

	driftCount := 0
	for _, localVer := range localMigrations {
		appliedState, exists := appliedMigrations[localVer]
		if !exists {
			fmt.Printf("[DRIFT WARNING] Migration %s is present in repository but has NOT been applied to the local DB\n", localVer)
			driftCount++
		} else if appliedState.Dirty {
			fmt.Printf("[DRIFT ERROR] Migration %s is in a DIRTY state in the local DB\n", localVer)
			driftCount++
		}
	}

	return driftCount, nil
}
This function identifies structural drifts that would cause runtime failures. A local database with $N(schema_diffs) \ge 1$ represents a highly critical drift vector.
Remediation Patterns: Establishing a Self-Healing Dev Loop
Collecting data and calculating drift indexes is a diagnostic step, but it must be coupled with active remediation. A platform engineering team should establish a three-tiered enforcement policy:
- Passive Telemetry and Warnings (Soft Enforcement): When a developer runs a build, the terminal prints a footer showing how their local build time compares to the team’s historical average. If $L_{system}$ is in the 90th percentile, it offers suggestions:
>>> Telemetry Report: Incremental build took 42.4s (Team P50 is 4.2s). [TIP] Your Docker engine is allocating only 2GB of RAM. Increase allocations to 8GB. [TIP] Over 42 dangling docker volumes detected. Run 'docker volume prune' to release IOPS pressure. - Push Gates (Hard Enforcement): If the pre-push hook determines that the database schema drift index is non-zero ($DS_i \ge 0.45$), it blocks the Git push action. The developer cannot open a PR with structural drift. The output provides a single, copy-pasteable command to self-heal:
>>> PUSH BLOCKED: Database Schema Drift Detected. Your local DB schema has 2 unapplied migration files. To remediate, run: dev-tool sync-db - Transitioning to Cloud Developer Environments (CDEs): Ultimately, local machines (MacBooks, Linux workstations) are high-friction targets for standardization. The long-term architectural resolution to local environment drift is migrating workloads off local hardware. Modern setups implement containerized environments running in Kubernetes (using systems like Devcontainers, Gitpod, or vcluster).
By executing the entire dev-loop inside remote, identical container pods, compilation phases can tap into distributed build networks (e.g., Bazel remote caching, ccache, sccache). This brings incremental build times down to milliseconds, while eliminating environment drift completely by ensuring the development shell matches the exact base image, network topology, and database versions targeted for production.
Establishing this quantitative framework changes platform engineering from a battle of subjective opinions to a discipline of continuous optimization. By treating developer inner-loops with the same operational rigor as production request flows, you establish a loop that is fast, standard, and secure.