Designing a Quantitative Engineering Metric for On-Call Burnout: Measuring PagerDuty Fatigue to Drive Operational Ownership
Stop counting raw alert volume. Learn how to design, build, and operationalize a weighted Pager Fatigue Score (PFS) to quantify on-call burnout and enforce true service ownership.
At 3:14 AM, the pager screams. A senior engineer wakes up, fumbles for their phone, acknowledges a transient database connection timeout that self-heals three minutes later, and struggles to fall back asleep. At 4:45 AM, another alert triggers: a non-critical queue’s consumer lag has slightly exceeded the 95th percentile. By 9:00 AM, that same engineer is expected to attend the daily standup, participate in architectural reviews, and write high-throughput concurrent Go code. While standard Site Reliability Engineering (SRE) dashboards proudly display “99.9% uptime” and a modest “20 alerts per week,” the human cost remains invisible. The fundamental error engineering organizations make is measuring alert volume rather than cognitive disruption. Counting alerts treats a 2:00 PM page the same as a 3:00 AM sleep disruption, masking severe developer burnout under the guise of green service-level indicators (SLIs). To solve this, we must build a quantitative, weighted Pager Fatigue Score (PFS) that maps operational pain to a concrete metric, allowing teams to halt feature development when burnout thresholds are breached.
The Fallacy of Raw Alert Volume
Traditional on-call reporting is broken because it relies on raw counts. A dashboard showing that “Team A received 45 alerts this week” tells us nothing about the health of the engineers on that team.
Consider two distinct scenarios:
- Engineer A is paged 15 times between 10:00 AM and 4:00 PM on a Tuesday. The alerts are triggered by a misconfigured rate limiter during a load test. They acknowledge and resolve them from their desk.
- Engineer B is paged twice: once at 2:15 AM and again at 4:30 AM. Both are transient memory leaks in a background worker that self-correct after 10 minutes.
If we look at raw volume, Engineer A appears to be experiencing more operational pain. In reality, Engineer A suffered minor context-switching overhead, whereas Engineer B experienced sleep fragmentation.
Sleep fragmentation destroys cognitive performance. When an engineer is awoken by a high-urgency pager alarm, they do not simply wake up, press a button, and return to deep sleep. The human body responds to emergency alarms with an acute release of cortisol and adrenaline. This triggers a state of physiological hyperarousal, making it difficult to return to sleep. Even if they fall asleep quickly, the micro-awakening disrupts their Slow-Wave Sleep (SWS) and Rapid Eye Movement (REM) cycles.
The resulting cognitive deficit is equivalent to a blood-alcohol concentration of 0.05% the following morning. Studies in sleep medicine show that sleep fragmentation leads to:
- Decreased working memory capacity: Woken-up engineers are more prone to committing logical errors, introducing security bugs, or dropping database tables.
- Impaired risk assessment: Exhausted engineers are more likely to apply quick-fix patches that mask root issues rather than resolving them.
- Loss of emotional regulation: Burnout erodes psychological safety, causing team friction and eventual attrition.
Therefore, any engineering metric that seeks to measure on-call health must treat night-time and weekend pages as orders of magnitude more expensive than daytime pages. It must also account for frequency compounding: receiving three pages in a single night is exponentially worse than receiving three pages spread across a week.
The PFS Framework: Mathematical Modeling of Fatigue
To represent this operational reality, we define the Pager Fatigue Score (PFS). The PFS quantifies the cognitive tax imposed on an individual engineer over a rolling evaluation window (typically 7 days).
The total PFS for an engineer is the sum of the fatigue scores of all individual alerts they received, adjusted by time of day, urgency, and consecutiveness:
\[PFS = \sum_{i=1}^{n} \left( W_{time}(t_i) \times W_{urgency}(u_i) \times M_{consec}(t_i) \right)\]Where:
- $t_i$ is the local time of day when the alert was triggered.
- $u_i$ is the urgency level of the alert as defined in PagerDuty.
- $W_{time}(t_i)$ is the time-of-day weight.
- $W_{urgency}(u_i)$ is the urgency weight.
- $M_{consec}(t_i)$ is the compounding consecutiveness multiplier.
1. Time-of-Day Weight ($W_{time}$)
We categorize the day into three distinct shifts based on human circadian rhythms and expected working hours:
| Period | Local Time Range | Weight ($W_{time}$) | Description |
|---|---|---|---|
| Business Hours | 09:00 - 17:59 | 1.0 |
Minor context-switching tax. |
| Shoulder/Off Hours | 06:00 - 08:59, 18:00 - 21:59 | 3.0 |
Disruption to personal time, family, and relaxation. |
| Sleep Hours | 22:00 - 05:59 | 8.0 |
Waking state, circadian disruption, high cognitive tax. |
Note: If the alert falls on a weekend (Saturday/Sunday) or a designated company holiday, we add a flat $+2.0$ scalar to the active multiplier (e.g., weekend business hours become 3.0, weekend sleep hours become 10.0).
2. Urgency Weight ($W_{urgency}$)
Not all alerts demand the same level of response. We utilize PagerDuty’s native urgency levels:
- High Urgency (
2.5): Requires immediate acknowledgment. If unacknowledged, it escalates. This bypasses system silences and physically vibrates the device. - Low Urgency (
0.5): Non-waking. Sent via Slack or email. Does not trigger persistent phone notifications.
3. Consecutiveness Multiplier ($M_{consec}$)
Alerts that occur in close succession compound cognitive exhaustion. We define the consecutiveness multiplier based on the elapsed time $\Delta t$ since the engineer’s last received alert:
\[M_{consec}(t_i) = \begin{cases} 2.5 & \text{if } \Delta t \le 1 \text{ hour} \\ 1.5 & \text{if } 1 \text{ hour} < \Delta t \le 4 \text{ hours} \\ 1.0 & \text{if } \Delta t > 4 \text{ hours} \end{cases}\]If it is the first alert of the shift, $M_{consec}$ defaults to 1.0.
Walkthrough Scenario A: The Sleep-Interrupted Shift
Let’s calculate the PFS for an engineer on a Tuesday night:
- 02:15 AM: Alert 1 triggers (High Urgency).
- $W_{time} = 8.0$ (Sleep hours)
- $W_{urgency} = 2.5$
- $M_{consec} = 1.0$ (First alert)
- Score $= 8.0 \times 2.5 \times 1.0 = 20.0$
- 03:00 AM: Alert 2 triggers (High Urgency).
- $\Delta t = 45\text{ minutes} \implies M_{consec} = 2.5$
- $W_{time} = 8.0$ (Sleep hours)
- $W_{urgency} = 2.5$
- Score $= 8.0 \times 2.5 \times 2.5 = 50.0$
- 04:15 AM: Alert 3 triggers (High Urgency).
- $\Delta t = 75\text{ minutes} \implies M_{consec} = 1.5$
- $W_{time} = 8.0$ (Sleep hours)
- $W_{urgency} = 2.5$
- Score $= 8.0 \times 2.5 \times 1.5 = 30.0$
Total PFS for this night = 100.0
Walkthrough Scenario B: The Daytime Flapping Alert
Let’s calculate the PFS for an engineer during the day:
- 11:00 AM: Alert 1 triggers (High Urgency).
- $W_{time} = 1.0$ (Business hours)
- $W_{urgency} = 2.5$
- $M_{consec} = 1.0$
- Score $= 1.0 \times 2.5 \times 1.0 = 2.5$
- 11:15 AM: Alert 2 triggers (High Urgency).
- $\Delta t = 15\text{ minutes} \implies M_{consec} = 2.5$
- $W_{time} = 1.0$
- $W_{urgency} = 2.5$
- Score $= 1.0 \times 2.5 \times 2.5 = 6.25$
Total PFS for this sequence = 8.75
Even though the engineer in Scenario A was paged 3 times and the engineer in Scenario B was paged 2 times, the sleep-interrupted engineer’s PFS is 11.4x higher than the daytime engineer’s PFS. This reflects the biological reality of sleep deprivation.
Ingestion and Data Architecture
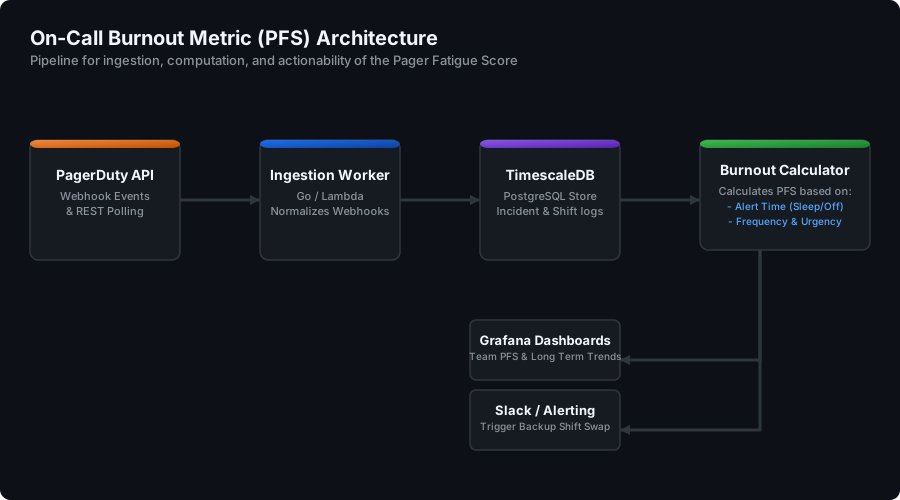
To compute the PFS, we must build a reliable pipeline that ingests events from PagerDuty, normalizes them, stores them in a time-series database, and exposes them for calculation.
+------------------+     Webhook     +-------------------+
|  PagerDuty API   | --------------->| Ingestion Service |
| (Webhook Events) |                 | (Go / Lambda)     |
+------------------+                 +-------------------+
                                               |
                                               v Write
                                     +-------------------+
                                     |    TimescaleDB    |
                                     | (PostgreSQL Store)|
                                     +-------------------+
                                               |
                                               v Query
                                     +-------------------+
                                     |Burnout Calculator |
                                     | (Python / Cron)   |
                                     +-------------------+
                                       /               \
                                      /                 \
                                     v                   v
                            +-----------------+  +---------------+
                            | Grafana Board   |  | Slack Alerts  |
                            | (Visualization) |  | (Escalations) |
                            +-----------------+  +---------------+
1. PagerDuty Webhooks
We configure a PagerDuty generic webhook (V3) at the account level to listen for the following events:
incident.triggeredincident.acknowledgedincident.resolved
2. Database Schema (TimescaleDB)
We store the raw alert data in TimescaleDB (a PostgreSQL extension optimized for time-series data). This allows us to perform fast window queries and timezone conversions.
-- Enable TimescaleDB extension
CREATE EXTENSION IF NOT EXISTS timescaledb CASCADE;

-- Responders lookup table
CREATE TABLE responders (
    responder_id VARCHAR(64) PRIMARY KEY,
    name VARCHAR(255) NOT NULL,
    email VARCHAR(255) NOT NULL,
    timezone VARCHAR(64) DEFAULT 'UTC' -- Configured responder timezone
);

-- Incidents table
CREATE TABLE oncall_incidents (
    incident_id VARCHAR(64) NOT NULL,
    responder_id VARCHAR(64) NOT NULL REFERENCES responders(responder_id),
    service_id VARCHAR(64) NOT NULL,
    service_name VARCHAR(255) NOT NULL,
    urgency VARCHAR(16) NOT NULL, -- 'high', 'low'
    triggered_at TIMESTAMPTZ NOT NULL,
    acknowledged_at TIMESTAMPTZ,
    resolved_at TIMESTAMPTZ,
    escalation_policy_id VARCHAR(64),
    PRIMARY KEY (incident_id, triggered_at)
);

-- Convert to hypertable for time-series optimization
SELECT create_hypertable('oncall_incidents', 'triggered_at');

-- Indexing for fast responder-based window searches
CREATE INDEX idx_responder_triggered_at
ON oncall_incidents (responder_id, triggered_at DESC);
The Calculation Engine
The primary software engineering challenge is timezone localization. If an engineer lives in Jakarta (Asia/Jakarta), their midnight is 5:00 PM UTC. If we run calculations in UTC, a 3:00 AM Jakarta page (which is sleep-disruptive) would be categorized as a 8:00 PM UTC page (shoulder hours), underestimating their fatigue.
The calculation engine must:
- Fetch the responder’s timezone configuration.
- Convert the incident’s UTC timestamp to the responder’s local timezone.
- Compute the active weights based on the localized time.
- Apply the consecutiveness logic chronologically.
Here is a Python implementation of the PFS calculator:
import datetime
from typing import List, Optional
from dataclasses import dataclass
from zoneinfo import ZoneInfo

@dataclass
class IncidentEvent:
    incident_id: str
    urgency: str  # 'high' or 'low'
    triggered_at: datetime.datetime  # Must be timezone-aware (UTC)
    resolved_at: Optional[datetime.datetime] = None

class PFSCalculator:
    def __init__(self, responder_timezone: str):
        self.tz = ZoneInfo(responder_timezone)

    def _get_time_weight(self, dt: datetime.datetime) -> float:
        """
        Determines the base weight based on localized time.
        Sleep: 22:00 - 05:59 (8.0)
        Shoulder: 06:00 - 08:59, 18:00 - 21:59 (3.0)
        Business: 09:00 - 17:59 (1.0)
        Weekend/Holiday: flat +2.0
        """
        local_dt = dt.astimezone(self.tz)
        hour = local_dt.hour
        is_weekend = local_dt.weekday() in (5, 6)  # 5 = Saturday, 6 = Sunday

        if 22 <= hour or hour < 6:
            base_weight = 8.0
        elif (6 <= hour < 9) or (18 <= hour < 22):
            base_weight = 3.0
        else:
            base_weight = 1.0

        if is_weekend:
            base_weight += 2.0

        return base_weight

    def _get_urgency_weight(self, urgency: str) -> float:
        return 2.5 if urgency.lower() == "high" else 0.5

    def calculate(self, incidents: List[IncidentEvent]) -> float:
        """
        Calculates the cumulative Pager Fatigue Score for a chronologically
        sorted list of incidents.
        """
        if not incidents:
            return 0.0

        # Ensure incidents are sorted chronologically
        sorted_incidents = sorted(incidents, key=lambda x: x.triggered_at)

        total_score = 0.0
        last_triggered: Optional[datetime.datetime] = None

        for incident in sorted_incidents:
            time_w = self._get_time_weight(incident.triggered_at)
            urgency_w = self._get_urgency_weight(incident.urgency)

            # Compute consecutiveness multiplier
            if last_triggered is None:
                consec_m = 1.0
            else:
                delta_t = incident.triggered_at - last_triggered
                hours_diff = delta_t.total_seconds() / 3600.0

                if hours_diff <= 1.0:
                    consec_m = 2.5
                elif hours_diff <= 4.0:
                    consec_m = 1.5
                else:
                    consec_m = 1.0

            incident_score = time_w * urgency_w * consec_m
            total_score += incident_score

            last_triggered = incident.triggered_at

        return round(total_score, 2)
Actionability and Policy Enforcement
A metric is useless if it does not drive systemic action. We define four operational ranges for individual and team PFS, and attach specific runbooks to each.
The PFS Severity Matrix
  0                           15                           30                           50
  +----------------------------+----------------------------+----------------------------+----------------------------+
  |           GREEN            |           YELLOW           |           ORANGE           |            RED             |
  |         (Healthy)          |         (Elevated)         |          (Warning)         |          (Crisis)          |
  +----------------------------+----------------------------+----------------------------+----------------------------+
  | • Normal operations.       | • Review in Standup.       | • Slack alert to Manager.  | • Mandatory pager swap.    |
  | • Feature work continues.  | • Minor alert tuning.      | • Voluntary shift handoff. | • Day off (No Slack/code). |
  |                            |                            | • Post-mortem required.    | • 100% Reliability focus.  |
  +----------------------------+----------------------------+----------------------------+----------------------------+
1. Green Range (0 - 14)
- Status: Healthy operational load.
- Action: Normal operations. Feature development proceeds as planned.
2. Yellow Range (15 - 29)
- Status: Elevated operational load.
- Action: The team lead reviews these alerts during the morning standup. The team identifies flapping rules and files Jira tickets to silence or adjust thresholds immediately.
3. Orange Range (30 - 49)
- Status: Serious fatigue. The engineer is experiencing high cognitive load.
- Action: An automated Slack alert notifies the Engineering Manager. The manager should offer the secondary on-call engineer the option to take over the primary pager for the next 24 hours. The team schedules an immediate triage meeting to debug the unstable microservices.
4. Red Range (50+) - The Burnout Redline
- Status: High risk of burnout.
- Action: The primary engineer is automatically removed from the active on-call rotation schedule using the PagerDuty API. The secondary on-call (or the team lead) is assigned as the primary. The burned-out engineer is given a mandatory recovery day: they are blocked from joining standup, writing code, or logging into Slack. The manager holds a mandatory incident review to document the systemic failures that triggered this state.
Enforcing the Feature Freeze
The ultimate goal of PFS is to drive operational ownership. Under traditional workflows, developers deploy unstable microservices and offload the operational pain onto the on-call engineer, while product owners continue to prioritize features.
To correct this incentive structure, we enforce a organizational rule: The PFS Error Budget.
Every team is assigned a maximum weekly collective PFS threshold (e.g., $150$ points for a team of 6 engineers). If the collective PFS exceeds this threshold for two consecutive weeks:
- Feature Freeze: The team’s CI/CD pipelines block all non-critical feature deployments.
- Re-allocation of Capacity: The team’s sprint goal is overridden. 100% of engineering capacity is redirected to reliability tasks:
- Refactoring database queries to eliminate CPU bottlenecks.
- Implementing circuit breakers and fallback responses.
- Tuning telemetry thresholds to prevent flapping alerts.
- Deprecating noisy, non-actionable alerts.
Product owners cannot bypass this block. This aligns the incentives of business stakeholders with the operational health of the engineering team.
Failure Modes and Anti-Patterns of PFS Implementation
When implementing PFS in production, watch out for the following failure modes:
1. Alert Classification Gaming
When developers realize that high-urgency alerts during sleep hours drive up the PFS (and potentially block feature shipments), they may downgrade critical alerts to low-urgency.
- Failure Mode: A critical, user-facing database connection pool exhaustion alert is downgraded to “Low Urgency” to avoid PFS penalties, leading to silent, prolonged outages.
- Mitigation: Automated checks in the deployment pipeline must validate alert rules. Any alert configured to target the primary on-call rotation MUST be verified as “High Urgency”. The PFS calculator should audit PagerDuty configuration changes.
2. Timezone Configuration Drift
Engineers frequently travel or relocate without updating their timezone configuration in PagerDuty or the database.
- Failure Mode: An engineer updates their shift to work from Tokyo while their profile is configured for London. A 3:00 AM Tokyo page is calculated as a 6:00 PM London page, missing the sleep-disruption weight.
- Mitigation: Build an automated script that cross-references the engineer’s active HR location or login IP geolocation with their PagerDuty timezone configuration, prompting them to resolve mismatches.
3. Metric-Driven Victim Blaming
Management may misinterpret the PFS as a reflection of an individual engineer’s performance rather than system reliability.
- Failure Mode: An engineer is penalized during performance reviews for having a high PFS, under the assumption that “good engineers do not get paged.”
- Mitigation: Emphasize that PFS measures the system’s instability, not the engineer’s capability. A high PFS is a failure of system architecture and product planning, not the responder.
Conclusion
Operational resilience is not just about server uptime; it is about human durability. Measuring raw alert volumes hides the real cost of microservice instability behind green uptime dashboards. By implementing a timezone-aware, weighted Pager Fatigue Score (PFS), engineering organizations can quantify the human cost of on-call.
This metric shifts the conversation from subjective complaints about on-call fatigue to an objective, math-driven feedback loop. Integrating this score with automatic rotation changes and feature-freeze enforcement ensures that service reliability remains a shared priority, protecting engineers from burnout and ensuring a healthier production environment.