Designing an On-Call Health Score: A Quantitative Framework for Tracking Alert Fatigue, Sleep Disruption, and Actionability
A mathematical, production-ready framework to measure and mitigate developer burnout by quantifying sleep disruption, alert noise, and actionability.
At 3:14 AM on a Thursday, a high-severity page wakes up your primary on-call engineer. The alert indicates that a secondary database replica’s CPU utilization has spiked to 92%. The engineer, disoriented and sleep-deprived, logs in, checks the primary database health, confirms read latency is unaffected, and watches the CPU utilization drop back to normal as a long-running analytical query finishes. They click “Acknowledge” and go back to sleep. Two hours later, they are paged again for a transient network blip in a non-critical microservice that self-heals in 90 seconds. The next day, the same engineer reviews a critical pull request for a payment processing database migration. Suffering from acute cognitive fatigue, they miss a missing index on a high-throughput foreign key, triggering a database deadlock that takes down production for four hours. Traditional monitoring systems recorded this on-call week as a success: the Mean Time to Acknowledge (MTTA) was under 3 minutes, and all alerts resolved quickly. But in reality, the operational culture is bleeding out, and your team is on the fast track to burnout and high attrition.
The Illusion of MTTR: Why Traditional Metrics Fail Engineering Teams
Engineering managers love dashboards that track Mean Time to Acknowledge (MTTA) and Mean Time to Resolution (MTTR). These metrics are neat, clean, and easily presented to executives to prove that the operations team is “on top of incidents.” However, relying on MTTA and MTTR as indicators of operational health is a severe anti-pattern.
First, traditional metrics are highly susceptible to “alert hacking.” When engineers are measured on MTTA, their natural incentive is to acknowledge alerts as fast as possible—often within seconds via a mobile app or Slack shortcut—without actually understanding the root cause. The timer stops, the SLA is met, but the cognitive interruption has already occurred.
Second, simple metrics treat all alerts as equal. An alert triggered at 2:00 PM on a Tuesday causes a minor context switch. The same alert triggered at 2:00 AM on a Tuesday disrupts a deep sleep cycle, triggering a cortisol spike and introducing cognitive impairment that degrades decision-making capacity for the next 24 hours. A study by the Sleep Research Society shows that sleeping fewer than 6 hours a night leads to cognitive deficits equivalent to a blood alcohol concentration of 0.05%. Yet, under standard tracking, both alerts count as exactly “1 incident” in the weekly report.
Finally, traditional systems fail to measure actionability. If an on-call rotation pages an engineer 50 times a week, but 45 of those pages are for auto-resolving disk space warnings, flapping CPU metrics, or non-critical backups, the engineer develops “alarm fatigue.” They begin to ignore warnings, delaying response times for genuine, catastrophic failures. We must replace these shallow metrics with a holistic, quantitative index: the On-Call Health Score (OCHS).
The Mathematical Model: Deconstructing the On-Call Health Score (OCHS)
The On-Call Health Score is a quantitative metric calculated per engineer, per shift, mapping directly to a 0–100 scale, where 100 represents zero operational impact and scores below 60 indicate a critical burnout state.
The formula is defined as:
\[\text{OCHS} = \max\left(0, 100 - (P_{\text{sleep}} + P_{\text{noise}} + P_{\text{density}} + P_{\text{ooh}})\right)\]Where:
- $P_{\text{sleep}}$ is the Sleep Disruption Penalty.
- $P_{\text{noise}}$ is the Alert Noise & Actionability Penalty.
- $P_{\text{density}}$ is the Interruption Density Penalty.
- $P_{\text{ooh}}$ is the Out-of-Hours Penalty.
1. Sleep Disruption Penalty ($P_{\text{sleep}}$)
This is the heaviest penalty. It targets alerts triggered during the standard sleep window (defined locally for the engineer, typically 22:00 to 06:00).
\[P_{\text{sleep}} = \sum_{i=1}^{N_{\text{night}}} W_{\text{time}}(t_i) \times W_{\text{actionable}}(a_i)\]- Time Weight ($W_{\text{time}}$): Interruption severity varies by circadian cycle.
- 22:00 - 00:00 (Onset): $W_{\text{time}} = 2.0$
- 00:00 - 05:00 (Deep Sleep): $W_{\text{time}} = 6.0$
- 05:00 - 06:00 (Late Sleep): $W_{\text{time}} = 3.0$
- Actionability Multiplier ($W_{\text{actionable}}$): Being woken up for a non-actionable alert is psychologically more destructive than being woken up for a real production emergency.
- If the alert was Actionable: $W_{\text{actionable}} = 1.0$
- If the alert was Non-Actionable (Noise): $W_{\text{actionable}} = 2.0$
2. Alert Noise & Actionability Penalty ($P_{\text{noise}}$)
This penalty captures the percentage of alerts that did not require any actual human intervention.
\[P_{\text{noise}} = K_{\text{noise}} \times \left(1 - \frac{A_{\text{actionable}}}{A_{\text{total}}}\right)\]- Where $A_{\text{actionable}}$ is the number of incidents requiring manual mitigation (e.g., rolling back a deployment, scaling up infrastructure, executing a specific database query).
- $A_{\text{total}}$ is the total number of pages received.
- $K_{\text{noise}}$ is a scaling coefficient, set to $30.0$. If 100% of your alerts are noise, you suffer the full 30-point deduction.
3. Interruption Density Penalty ($P_{\text{density}}$)
Alerts that arrive in rapid succession are part of the same cascade. Getting paged 5 times in 15 minutes for a single database outage is highly stressful, but it represents one continuous context switch. However, getting paged 5 times, spaced exactly 45 minutes apart, destroys an entire day’s capacity for focus.
We bucket alerts using a sliding window of $20 \text{ minutes}$.
\[P_{\text{density}} = K_{\text{density}} \times \max\left(0, N_{\text{blocks}} - 1\right)\]- Where $N_{\text{blocks}}$ is the number of distinct 20-minute blocks containing at least one page.
- $K_{\text{density}}$ is set to $4.0$. This penalizes fragmented, repeated interruptions throughout the day.
4. Out-of-Hours Penalty ($P_{\text{ooh}}$)
Alerts that disrupt personal life, weekends, and national holidays carry an additional emotional cost.
\[P_{\text{ooh}} = \sum_{j=1}^{N_{\text{ooh}}} W_{\text{ooh}}(t_j)\]- Weekend Alert: $W_{\text{ooh}} = 3.0$ per alert block.
- Holiday Alert: $W_{\text{ooh}} = 5.0$ per alert block.
- Weekday Off-Hours (18:00 - 22:00): $W_{\text{ooh}} = 1.0$ per alert block.
Ingestion and Pipeline Architecture
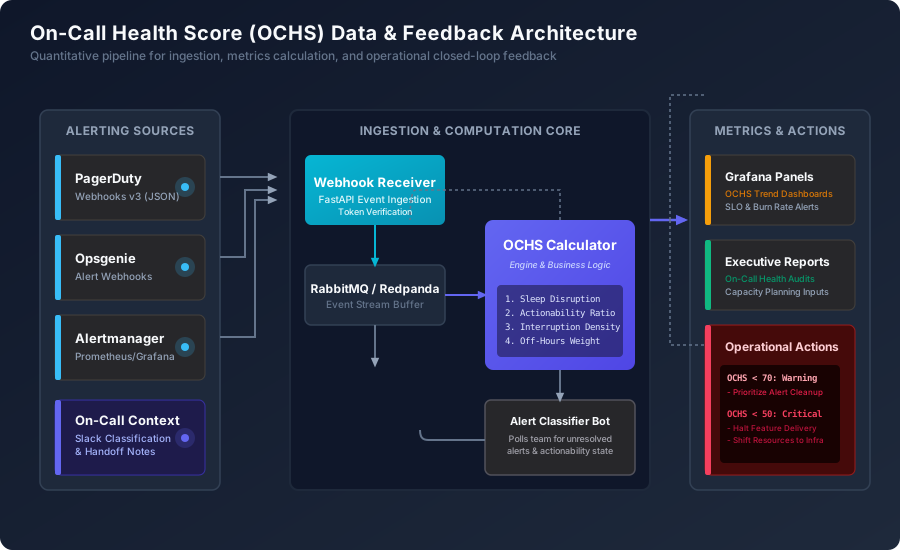
To implement this framework, you need a lightweight, event-driven data pipeline that interfaces with your alerting providers (PagerDuty, Opsgenie, Alertmanager) and records metadata about alerts and shift rosters.
The architecture comprises a fast webhook ingestion service that writes to a database with time-series extensions, coupled with a Slack bot to capture user feedback on incident actionability.
Below is the database schema designed for PostgreSQL (with TimescaleDB extension enabled for scaling event tables):
-- Enables tracking of shifts and roster details
CREATE TABLE on_call_shifts (
    id UUID PRIMARY KEY DEFAULT gen_random_uuid(),
    engineer_email VARCHAR(255) NOT NULL,
    team_name VARCHAR(100) NOT NULL,
    timezone VARCHAR(50) NOT NULL DEFAULT 'Asia/Jakarta',
    start_time TIMESTAMPTZ NOT NULL,
    end_time TIMESTAMPTZ NOT NULL,
    CONSTRAINT valid_shift_range CHECK (end_time > start_time)
);

-- Main table for paged incidents
CREATE TABLE incidents (
    id VARCHAR(100) PRIMARY KEY, -- Maps directly to PagerDuty/Opsgenie Incident ID
    shift_id UUID REFERENCES on_call_shifts(id) ON DELETE SET NULL,
    service_name VARCHAR(150) NOT NULL,
    alert_title TEXT NOT NULL,
    created_at TIMESTAMPTZ NOT NULL,
    resolved_at TIMESTAMPTZ,
    auto_resolved BOOLEAN DEFAULT FALSE,
    severity VARCHAR(50) NOT NULL DEFAULT 'CRITICAL'
);

-- Actionability and classification feedback
CREATE TABLE incident_feedback (
    incident_id VARCHAR(100) PRIMARY KEY REFERENCES incidents(id) ON DELETE CASCADE,
    classified_by VARCHAR(255) NOT NULL,
    is_actionable BOOLEAN NOT NULL,
    classification_reason VARCHAR(50) NOT NULL,
    -- Options: 'runbook_mitigation', 'code_rollback', 'resource_scaling',
    --          'transient_auto_resolve', 'flapping_threshold', 'duplicate_alert'
    action_taken TEXT,
    updated_at TIMESTAMPTZ DEFAULT NOW()
);

-- Indexing for rapid queries over sliding windows
CREATE INDEX idx_incidents_created_at ON incidents(created_at DESC);
CREATE INDEX idx_on_call_shifts_range ON on_call_shifts(start_time, end_time);
Closing the Feedback Loop: Classifying Actionability
A mathematical framework is only as good as its underlying data. While timestamp data can be parsed directly from alerting APIs, determining whether an alert was actionable requires human context. We implement a two-pronged approach to solve this: automatic heuristics and interactive ChatOps.
Heuristic Auto-Classification
If an incident resolves itself via a webhook event from system or alertmanager within 300 seconds of creation without any manual acknowledgment from an engineer, the ingestion worker automatically marks it:
is_actionable = falseclassification_reason = 'transient_auto_resolve'auto_resolved = true
ChatOps Post-Shift Verification
For incidents that were manually acknowledged and resolved, we close the loop via Slack. At 09:00 AM on the day following a shift, a Slack bot queries the database for all unresolved feedback rows associated with the active engineer. It sends an interactive message block:
🚨 On-Call Alert Feedback Required

Hey @muklis, you had 3 pages during your shift yesterday. Let's optimize our alert configuration:

1. incident #88329: "High p99 Latency on /v1/checkout" (02:45 AM)
   Was this actionable?
   [ Actionable 🟩 ]   [ Non-Actionable / Noise 🟥 ]
Clicking Actionable brings up a modal to select the remediation action (e.g., Code Rollback, DB Scaling). Clicking Non-Actionable registers the alert as noise. The bot stores this feedback directly in the incident_feedback table. If the engineer fails to respond within 48 hours, the pipeline defaults the record to is_actionable = false and flags the classification reason as unclassified_expired to ensure the health score calculation isn’t blocked by missing inputs.
Operational Rules & Organizational Guardrails
The OCHS should not sit in an executive slide deck. It must act as an operational “circuit breaker” for the engineering team. Below is a formalized escalation policy based on OCHS ranges computed weekly.
| OCHS Range | Health State | Required Operational Actions |
|---|---|---|
| 90 - 100 | Green (Pristine) | Normal operations. The team focuses entirely on product roadmap delivery. |
| 70 - 89 | Yellow (Degraded) | The team lead must allocate 20% of the next sprint’s velocity directly to SRE cleanup. This focus is explicitly targeted at resolving the top two noise-producing alerts from the prior week. |
| 50 - 69 | Orange (Warning) | Alert debt has accumulated. The current on-call engineer is exempted from all standard sprint commitments and feature pull requests. Their sole ticket for the week is alert refactoring and runbook automation. |
| < 50 | Red (Critical) | Operational Circuit Breaker Active. Feature development for the entire squad is immediately halted. The whole team pivots to stability engineering. If an individual engineer’s score falls below 40 during a single shift, they are immediately rotated off-shift, and a backup takes over. The affected engineer is granted a mandatory, paid “recovery day” with Slack notifications disabled. |
By implementing these rules, engineering teams protect their members from burnout. Product managers quickly learn that if they push unstable features to production, they will lose development velocity as the OCHS circuit breaker triggers, aligning incentives across the entire organization.
Implementing OCHS: Production-Ready Code
Below is a complete, production-ready Python implementation for calculating the On-Call Health Score for a given shift. The script parses incident events, groups alerts into density windows, checks circadian hours based on the engineer’s timezone, and evaluates the final penalties.
from datetime import datetime, timedelta
import pytz

def get_local_time(dt_utc: datetime, tz_name: str) -> datetime:
    """Converts a UTC datetime object to the engineer's local timezone."""
    utc_tz = pytz.utc
    local_tz = pytz.timezone(tz_name)
    if dt_utc.tzinfo is None:
        dt_utc = utc_tz.localize(dt_utc)
    return dt_utc.astimezone(local_tz)

def is_weekend(dt_local: datetime) -> bool:
    """Checks if the datetime falls on a Saturday or Sunday."""
    return dt_local.weekday() >= 5

def calculate_sleep_penalty(created_at_local: datetime, is_actionable: bool) -> float:
    """
    Calculates the sleep disruption penalty based on circadian time windows.
    """
    hour = created_at_local.hour

    # Define sleep window penalties
    if 22 <= hour or hour < 0:
        base_weight = 2.0
    elif 0 <= hour < 5:
        base_weight = 6.0
    elif 5 <= hour < 6:
        base_weight = 3.0
    else:
        return 0.0  # Outside sleep window

    actionable_multiplier = 1.0 if is_actionable else 2.0
    return base_weight * actionable_multiplier

def calculate_density_blocks(alerts: list, window_minutes: int = 20) -> int:
    """
    Groups alerts into sliding windows to compute context switch frequency.
    """
    if not alerts:
        return 0

    # Sort alerts by created_at timestamp
    sorted_alerts = sorted(alerts, key=lambda x: x['created_at'])
    blocks = []

    for alert in sorted_alerts:
        ts = alert['created_at']
        placed = False
        for block in blocks:
            # Check if alert fits into an existing time window block
            if ts - block[0] <= timedelta(minutes=window_minutes):
                block.append(ts)
                placed = True
                break
        if not placed:
            blocks.append([ts])

    return len(blocks)

def calculate_ochs(alerts: list, shift_start: datetime, shift_end: datetime, tz_name: str = "Asia/Jakarta") -> dict:
    """
    Calculates the On-Call Health Score (OCHS) for a specific rotation shift.
    """
    p_sleep = 0.0
    p_ooh = 0.0

    total_alerts = len(alerts)
    if total_alerts == 0:
        return {
            "ochs": 100.0,
            "penalties": {
                "sleep": 0.0,
                "noise": 0.0,
                "density": 0.0,
                "ooh": 0.0
            },
            "metrics": {
                "total_alerts": 0,
                "actionable_alerts": 0,
                "actionability_ratio": 1.0
            }
        }

    actionable_count = sum(1 for a in alerts if a.get('is_actionable', True))
    actionability_ratio = actionable_count / total_alerts

    # 1. Sleep Penalty & Out-of-Hours Calculations
    for alert in alerts:
        created_utc = alert['created_at']
        created_local = get_local_time(created_utc, tz_name)
        is_act = alert.get('is_actionable', True)

        # Accumulate sleep penalties
        p_sleep += calculate_sleep_penalty(created_local, is_act)

        # Accumulate Out-of-Hours penalties (if not during sleep hours to prevent double-counting)
        is_sleep_hour = (22 <= created_local.hour or created_local.hour < 6)
        if not is_sleep_hour:
            if is_weekend(created_local):
                p_ooh += 3.0
            elif 18 <= created_local.hour < 22:
                p_ooh += 1.0

    # 2. Noise Penalty Calculation (Max deduction: 30)
    p_noise = 30.0 * (1.0 - actionability_ratio)

    # 3. Interruption Density Calculation
    density_blocks = calculate_density_blocks(alerts, window_minutes=20)
    p_density = 4.0 * max(0, density_blocks - 1)

    # Calculate final bounded score
    total_penalty = p_sleep + p_noise + p_density + p_ooh
    score = max(0.0, 100.0 - total_penalty)

    return {
        "ochs": round(score, 1),
        "penalties": {
            "sleep": round(p_sleep, 1),
            "noise": round(p_noise, 1),
            "density": round(p_density, 1),
            "ooh": round(p_ooh, 1)
        },
        "metrics": {
            "total_alerts": total_alerts,
            "actionable_alerts": actionable_count,
            "actionability_ratio": round(actionability_ratio, 2)
        }
    }

# Example Usage & Verification:
if __name__ == "__main__":
    # Mocking alerts for a rough weekend shift
    tz = "Asia/Jakarta"
    base_time = datetime(2026, 7, 31, 10, 0, 0, tzinfo=pytz.utc) # 17:00 local time

    sample_alerts = [
        # Woken up at 2:00 AM (Deep sleep) for a non-actionable issue (Noise)
        {
            "id": "pd-1",
            "created_at": base_time + timedelta(hours=9), # 02:00 AM local
            "is_actionable": False
        },
        # Paged at 2:10 AM - part of same density block, but sleep disruption compounds
        {
            "id": "pd-2",
            "created_at": base_time + timedelta(hours=9, minutes=10),
            "is_actionable": False
        },
        # Actionable weekend page at 3:00 PM
        {
            "id": "pd-3",
            "created_at": base_time + timedelta(hours=22), # 15:00 local (Saturday)
            "is_actionable": True
        }
    ]

    result = calculate_ochs(
        alerts=sample_alerts,
        shift_start=base_time,
        shift_end=base_time + timedelta(days=2),
        tz_name=tz
    )
    print(f"Computed OCHS: {result['ochs']}/100")
    print(f"Penalties Breakdown: {result['penalties']}")