Designing High-Throughput OpenTelemetry Collectors: Backpressure, Memory Limits, and Load Balancing
A production-tested blueprint for configuring OpenTelemetry Collectors to handle extreme telemetry loads without OOM-killing, losing traces, or hot-spotting downstream gateways.
At 100,000 requests per second, a sudden traffic spike or network partition doesn’t just degrade your telemetry system—it can cause a cascading OOM (Out of Memory) failure that takes down your entire production application. Most teams discover this the hard way: they instrument their microservices, deploy a central OpenTelemetry (OTel) Collector with default configurations, and watch it die under a load spike. As the Collector crashes, application client buffers fill up, memory pools saturate, and microservices begin OOM-killing themselves or lock up due to blocking trace exporters. Designing a resilient, high-throughput OTel pipeline requires a deep understanding of resource protection, backpressure propagation, and Layer 7 load balancing. This post provides the production-hardened blueprint for building collector infrastructure that survives extreme loads.
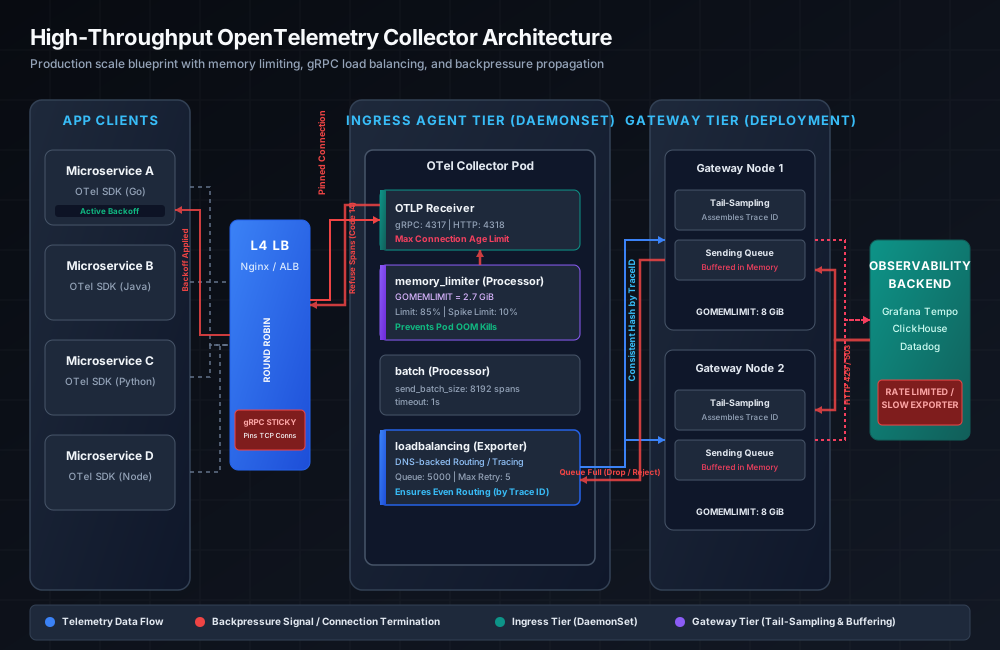
The High-Throughput Collector Pipeline: DaemonSet vs. Central Gateway
A naive architecture routes all telemetry directly from application instances to a central cluster of OTel Collectors. Under heavy traffic, this design fails due to network overhead, lack of local buffering, and the inability to run memory-intensive operations (like tail-based sampling) without massive, expensive central nodes.
A production-grade architecture divides the tracing pipeline into two distinct tiers:
- Ingress Agents (DaemonSet): Running on every Kubernetes node or as a local sidecar. Ingress agents are lightweight, optimized for low latency, and responsible for receiving local OTLP traffic over localhost or in-cluster network loops. They perform basic metadata decoration (e.g., Kubernetes pod labels), run memory protection via
memory_limiter, batch spans, and load-balance the telemetry downstream to the Gateway tier. - Central Gateways (Deployment): A horizontally scalable cluster of collectors that handle tail-based sampling, complex processing, and exporting to long-term storage backends (e.g., Grafana Tempo, ClickHouse, Datadog).
By separating concerns, your applications always have a low-latency local socket to dump telemetry into, while the central Gateway cluster handles the heavy lifting of trace assembly and sampling.
Memory Management, GOMEMLIMIT, and the Memory Limiter Processor
The OTel Collector is written in Go. Go’s runtime executes a non-generational, concurrent tri-color mark-and-sweep garbage collector (GC). By default, Go triggers a GC cycle when the heap size doubles (GOGC=100). In containerized environments like Kubernetes, where memory is capped by strict resource limits, this default behavior is a recipe for Out-Of-Memory (OOM) kills. If a massive traffic spike occurs, heap memory can double faster than the GC can run, pushing the container past its limit and triggering the kernel’s OOM killer.
Historically, teams used memory “ballasts” (allocating a large, unused slice to trick the GC into running at a higher baseline). Since Go 1.19, this hack has been superseded by GOMEMLIMIT. By setting the GOMEMLIMIT environment variable, you define a soft limit at which the Go runtime will trigger a GC cycle regardless of the GOGC value.
In a high-throughput Collector, you must pair GOMEMLIMIT with the memory_limiter processor. While GOMEMLIMIT forces garbage collection, the memory_limiter processor acts as the application-level gateway. When memory usage climbs past a configured threshold, the processor begins shedding load (refusing incoming data and dropping spans) to prevent the container from crashing.
To configure these correctly, you must align the memory limits of the container, the Go runtime (GOMEMLIMIT), and the memory_limiter processor settings. Use the following formula for production deployments:
- Container Memory Limit: $M_c$ (e.g.,
4GiB) - Go Memory Limit (
GOMEMLIMIT): Set to 90% of $M_c$ (e.g.,3.6GiBor3600MiB). This leaves a 10% headroom for runtime overhead, stack memory, and CGo memory. - Processor
limit_percentage: Set to 80-85% of $M_c$. This ensures the collector starts shedding load before Go reachesGOMEMLIMITand aggressively thrashes the CPU in continuous GC cycles. - Processor
spike_limit_percentage: The maximum amount of memory the processor expects to allocate during a single check interval. For high-throughput environments, set this to 5% to 10% to prevent sudden spikes from bypassing the limiter limit.
Backpressure Propagation: Retries, Queues, and Rejections
Backpressure is the mechanism by which downstream components signal congestion upstream, forcing producers to slow down rather than flooding buffers. In an OpenTelemetry pipeline, backpressure must propagate cleanly from the storage backend all the way back to the application SDK.
Here is how the chain behaves under load:
- Downstream Bottleneck: The storage backend (e.g., Tempo) becomes slow or starts returning
HTTP 429(Too Many Requests). - Gateway Exporter Queue Saturaion: The OTel Gateway’s
otlpexporter queue fills up. Thesending_queueconfiguration buffers traces in memory up to its limit (queue_size: 10000). Once full, the exporter refuses to accept new batches from processors. - Gateway Processor Saturation: The batch and tail-sampling processors can no longer push data downstream. They begin holding traces in memory, causing the Gateway’s memory usage to spike.
- Gateway Limiter Activation: The Gateway’s
memory_limiterdetects that memory has crossed 85%. It instructs the gRPC receiver to refuse new requests. - Receiver Reject: The Gateway receiver rejects OTLP requests from the Ingress Agents with gRPC code
UNAVAILABLE(status code 14) or HTTP503. - Agent Queue Saturation: The Ingress Agent’s
loadbalancingexporter queue fills up. When its internal queues are saturated, its ownmemory_limitertriggers, forcing it to reject spans from local application containers. - Application SDK Backoff: The client-side SDK in your application receives the OTLP transport rejection. If configured correctly, it buffers spans in its internal memory queue and applies exponential backoff, retrying the connection without blocking application threads.
If you misconfigure the client-side SDK—for example, by setting a synchronous exporter or an unbounded memory queue—your application will either block its HTTP/gRPC worker threads (leading to high latency and cascading API failures) or crash with an OOM.
The client-side OTel SDK must be configured with a bounded batch span processor and an explicit, non-blocking retry mechanism:
Solving the gRPC Load Balancing Conundrum
In a high-throughput microservices architecture, client-to-collector traffic is almost exclusively gRPC over HTTP/2. gRPC relies on HTTP/2 stream multiplexing, which reuses a single long-lived TCP connection for thousands of requests.
This introduces a severe load-balancing problem when using standard Layer 4 (L4) load balancers or default Kubernetes Service DNS routing:
- When an application pod starts, it performs a DNS lookup, resolves one of the collector pod IPs, and establishes a TCP connection.
- It sends all telemetry over this single connection.
- If you scale out your central OTel Collector cluster from 5 to 15 pods to handle a traffic surge, the existing TCP connections remain pinned to the original 5 pods. The new pods sit idle while the original pods are overwhelmed, trigger memory limits, and crash.
To distribute traffic evenly across your Collector pods, you have three options:
1. Layer 7 (L7) Proxying
Place an L7 load balancer (like Envoy or a service mesh linkerd/istio sidecar) between the applications and the collectors. The L7 proxy splits HTTP/2 streams and distributes requests evenly at the OTLP frame level. While this is highly effective, it introduces an extra network hop, increases latency, and significantly inflates infrastructure costs due to L7 payload parsing at scale.
2. Max Connection Age Configuration
Configure your OTel Collector receiver with a strict max_connection_age limit. This forces the collector to gracefully shut down TCP connections after a set duration, forcing clients to re-resolve DNS and connect to different collector pods.
While this prevents permanent hotspotting, it creates periodic “connection storms” where hundreds of application clients disconnect and reconnect simultaneously, causing transient ingestion latency spikes.
3. The Load-Balancing Exporter (Recommended)
In a two-tier (DaemonSet Agent to Central Gateway) architecture, the cleanest solution is the OTel loadbalancing exporter. Instead of relying on a proxy, the local Ingress Agent collector acts as a client-side load balancer.
The loadbalancing exporter queries the Kubernetes API or headless Service DNS to get a list of active Gateway collector IPs. It then consistent-hashes trace IDs to distribute spans across these IPs.
This achieves two critical outcomes:
- Trace ID Colocation: All spans sharing a specific
trace_idare guaranteed to route to the exact same Gateway collector pod. This is an absolute prerequisite for tail-based sampling, which requires assembling the full trace structure in memory to make a sampling decision. - Even Distribution: Under scaling events (horizontal autoscaling of the Gateway tier), the Ingress Agents dynamically pick up the new IPs and redistribute traces gracefully, without tearing down all connections or requiring a service mesh.
Real-World Failure Modes and SRE Runbook
Even with memory limiters and load-balancing exporters, production environments present edge cases that can degrade your telemetry pipeline. The table below outlines common failure modes, diagnostic symptoms, and SRE resolution strategies.
| Failure Mode | Symptoms | Root Cause | Remediation |
|---|---|---|---|
| Go Runtime GC Thrashing | High Collector CPU utilization, collector logs show frequent GC pauses, ingestion latency spikes. | Ingress or Gateway memory usage is hovering near GOMEMLIMIT, causing Go to execute back-to-back GC cycles. |
Increase container memory limit ($M_c$) and update GOMEMLIMIT. If resources are capped, adjust limit_percentage down in memory_limiter to trigger rejection earlier. |
| Collector OOM Kills | Collector pods crash with status OOMKilled. System logs show exit code 137. |
memory_limiter configuration is missing, or the check_interval is too long, allowing memory spikes to exceed container limits before detection. |
Decrease check_interval to 100ms. Ensure GOMEMLIMIT is strictly set to 90% of the container memory limit. |
| Silent Span Dropping | Downstream backend is healthy, but dashboard dashboards show incomplete traces or missing spans. | Ingress Agent is dropping spans due to queue saturation (sending_queue is full), but client SDK is silent. |
Check otelcol_processor_dropped_spans metric. Increase queue_size in the agent’s exporter or implement consumer-rate scaling in downstream gateways. |
| gRPC Connection Storms | CPU spikes on Gateway nodes, trace ingestion failures occur periodically every $N$ minutes. | max_connection_age on Gateway receivers is set to a fixed value (e.g., 5m) without jitter, causing simultaneous client reconnections. |
Introduce jitter using max_connection_age_grace and implement exponential backoff config in client application SDKs. |
Monitoring and Alerting
To catch these failures before they cause telemetry loss, you must monitor key internal metrics exposed by the OTel Collector’s Prometheus endpoint.
Conclusion
Designing a high-throughput OpenTelemetry Collector architecture is an exercise in defensive systems engineering. By deploying a two-tier topology, aligning Go’s garbage collector tuning (GOMEMLIMIT) with the application-level memory_limiter processor, implementing client-side load balancing with the loadbalancing exporter, and configuring non-blocking client SDK retries, you build a telemetry pipeline that remains resilient under extreme production workloads. Do not rely on defaults: tune your queues, size your buffers, and monitor dropped span metrics to maintain absolute visibility into your production applications.