Debugging JVM Safepoint Pauses and Safepoint Bias in High-Throughput Microservices
A deep dive into diagnosing JVM safepoint pauses, mitigating Time-To-Safepoint (TTSP) bottlenecks, and tuning safepoint bias to eliminate tail latency.
You are running a high-throughput Java microservice handling 15,000 requests per second. The average response time is a pristine 2 milliseconds, but your p99.9 tail latency is spiking to 300 milliseconds, causing cascade timeouts in your downstream API gateways. You check your Application Performance Monitoring (APM) dashboard and inspect your garbage collection logs. The garbage collection duration is reported as a mere 12 milliseconds, and heap utilization is healthy. The CPU isn’t saturated, memory pages aren’t swapping, and the network is quiet. So where is the 288-millisecond latency coming from? The answer almost certainly lies in the JVM’s safepoint subsystem: specifically, in the Time-To-Safepoint (TTSP) delay and the overhead of safepoint bias. This guide will walk you through the inner workings of safepoints, explain how compile-time optimizations like counted loop safepoint elimination can stall your application, and provide a concrete production-hardened diagnostic playbook to root out these tail latency anomalies once and for all.
The Anatomy of a JVM Safepoint
Before diagnosing latency spikes, we must understand what a safepoint actually is. A safepoint is a state where all application threads (known as mutators) are suspended, and their execution state is guaranteed to be consistent. This consistency allows the JVM’s internal engine, the VMThread, to safely perform operations that modify the state of the heap, stack, or metadata without race conditions.
Common JVM operations that require a global safepoint include:
- Garbage Collection: Reclaiming memory, moving objects, and updating references.
- Biased Locking Revocation: Revoking a thread’s exclusive lock ownership to hand it to another thread.
- Thread Dumps: Generating stack traces for troubleshooting (
jstackorjcmd). - Code Deoptimization: Reverting JIT-compiled native code back to interpreted bytecode when compiler assumptions are invalidated.
- Class Redefinition: Hot-swapping classes during debugging or instrumentation agent runs.
To bring all mutators to a halt, the HotSpot JVM uses a cooperative mechanism. Rather than asynchronously interrupting threads (which could leave registers or memory in an inconsistent state), the JVM compiler injects safepoint polls into the instruction stream of compiled Java code.
In older HotSpot architectures, these polls checked a global memory page called the polling page. When the JVM requested a safepoint, it changed the permissions of this page to read-protected. The next time a mutator thread executed a safepoint poll instruction, it attempted to read from the page, triggered a hardware page fault signal (SIGSEGV), and was suspended by the OS signal handler. In modern Java versions (JDK 10+), the JVM uses Thread-Local Handshakes, which allow individual threads to be paused independently by modifying their thread-local state, significantly reducing the global overhead of safepoint coordination. However, the requirement that threads must reach a safepoint poll remains unchanged.
Threads are only considered “safe” when they are in specific states:
- Blocked on a Monitor/Lock: Already suspended and unable to modify Java heap state.
- Executing JNI/Native Code: The thread is running non-Java code. The JVM can run a safepoint without waiting for this thread, but if the thread attempts to return to Java code, it must transition past a JVM barrier and will block if a safepoint is active.
- Executing JVM Runtime Code: The thread is executing internal VM operations and will halt itself when checking for safepoints.
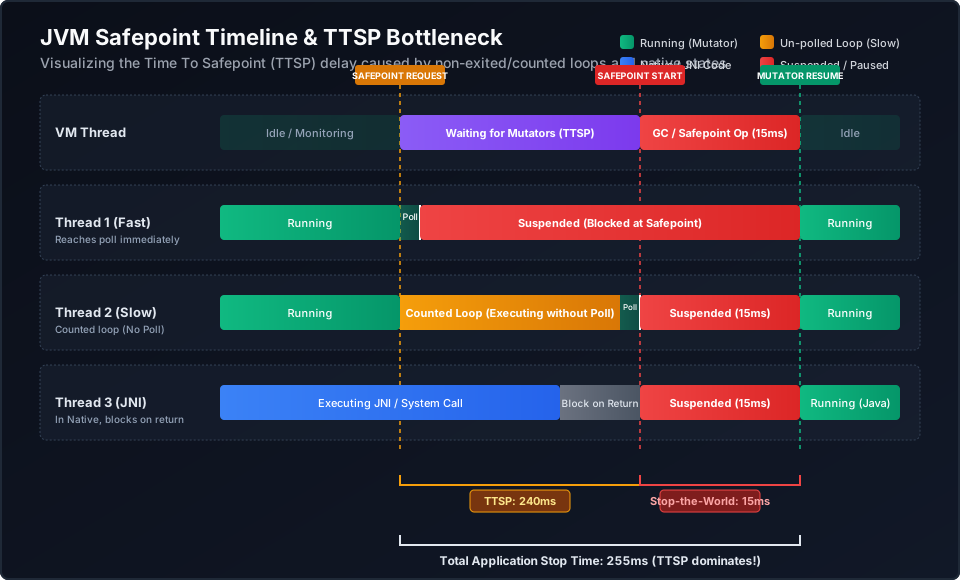
The critical issue occurs when a thread is running Java code but fails to execute a safepoint poll for an extended period, preventing the VMThread from starting the requested VM operation.
The Silent Killer: Time-To-Safepoint (TTSP)
When analyzing application pauses, most developers look at the duration of the VM operation itself (e.g., the GC cycle). However, the duration reported by many APM tools only measures the actual execution of the VM task. The true application pause time is defined by the following equation:
\[\text{Total Pause Time} = \text{Time to Safepoint (TTSP)} + \text{Safepoint Operation Duration}\]If the JVM schedules a garbage collection that takes 10 milliseconds, but one thread takes 290 milliseconds to check its safepoint poll, every other thread that reached its poll in 1 millisecond must sit idle for 289 milliseconds. The application experiences a 300-millisecond pause, while the GC log reports a fast 10-millisecond collection.
Counted Loop Safepoint Elimination
The most common culprit behind high TTSP in production microservices is the JIT compiler’s loop optimization. To minimize loop execution overhead, the C2 compiler distinguishes between two types of loops:
- Counted Loops: Loops where the loop counter is an
intorchar, incremented or decremented by a constant step, and has a clear termination condition (e.g.,for (int i = 0; i < limit; i++)). - Uncounted Loops: Loops where the condition is complex, or the counter is a
long(e.g.,while (condition)orfor (long i = 0; i < limit; i++)).
Because counted loops are highly structured, the JIT compiler assumes they will execute quickly. To maximize throughput, C2 optimizes counted loops by stripping out safepoint poll instructions inside the loop body. The thread will only poll for a safepoint after the loop completely terminates or before it enters.
If a microservice processes large datasets, parses XML/JSON payloads, hashes data, or performs cryptographic operations within a counted loop that runs millions of iterations, that thread will run unimpeded. If the VMThread requests a safepoint while this loop is executing, the entire JVM must wait. The resulting latency spike is proportional to the duration of the loop’s execution.
Here is a classic example of code that can trigger this failure mode:
package com.example.processor;

public class PayloadProcessor {
    public byte[] processData(byte[] input) {
        // C2 optimizer treats this as a counted loop and removes safepoint polls
        int length = input.length;
        byte[] result = new byte[length];
        for (int i = 0; i < length; i++) {
            // Expensive arithmetic/transformation in a counted loop
            result[i] = (byte) (Math.sin(input[i]) * 128);
        }
        return result;
    }
}
If the input array is large (e.g., several megabytes of data received in a batch request), this loop in PayloadProcessor.java can run for hundreds of milliseconds without a single safepoint check.
Page Faults and OS Interference
Another common source of high TTSP is OS-level memory management, particularly Transparent Huge Pages (THP). If the operating system is configured with THP enabled in always mode, the kernel periodically attempts to compact memory pages into 2MB huge pages.
If the JVM triggers a GC safepoint, the VMThread or GC worker threads may touch memory regions that trigger a synchronous page compaction or allocation block in the kernel. This puts the JVM thread into a kernel-level sleep state, blocking the transition of that thread to a safepoint. The JVM will report a massive TTSP while it waits for the OS to resolve the page fault.
The Performance Tax of Biased Locking & Safepoint Bias
Biased locking was introduced in early Java versions to optimize uncontended synchronization. The JVM “biases” a lock toward the first thread that acquires it. Subsequent lock acquisitions by that thread require no atomic operations or bus-locking instructions, yielding a significant performance boost for single-threaded synchronization patterns.
However, if another thread attempts to acquire a biased lock, the JVM must revoke the bias. This revocation is a complex metadata operation that requires bringing the biasee thread to a safepoint to rewrite the object header.
In high-throughput, modern microservices built on reactive frameworks (like Project Reactor or Vert.x) or virtual threads, tasks are dispatched across a pool of worker threads. Locks are frequently shared, resulting in high lock contention. In this environment, biased locking becomes a massive liability. The JVM repeatedly schedules safepoints solely to revoke biased locks, causing “Safepoint Bias” overhead.
The HotSpot JVM logs will show a high count of safepoints with the reason RevokeBias. Because of this overhead, biased locking was deprecated in JDK 15 and completely disabled by default. If your microservices are running on JDK 8 or JDK 11 without explicit tuning via UseBiasedLocking, you are paying a heavy latency tax for a feature designed for hardware architectures of two decades ago.
The Diagnostic Playbook
To root out safepoint latency, you must enable diagnostics that capture the duration of both the safepoint operations and the sync phases (TTSP).
Step 1: Enable JVM Safepoint Logging
You cannot fix what you do not measure. Add the following JVM arguments to your service deployment configuration.
For JDK 9 and higher, use the Unified JVM Logging interface (-Xlog):
-Xlog:safepoint=info,safepoint+stats=debug:file=/var/log/app/safepoint.log:time,uptime,pid:filecount=5,filesize=100M
For JDK 8, use the legacy print flags:
-XX:+UnlockDiagnosticVMOptions
-XX:+PrintSafepointStatistics
-XX:PrintSafepointStatisticsCount=1
-XX:+PrintGCApplicationStoppedTime
-XX:+LogVMOutput
-XX:LogFile=/var/log/app/vm.log
Step 2: Parse and Analyze the Logs
Once logging is enabled, monitor the log file. A typical safepoint log entry in JDK 11+ looks like this:
[2026-07-03T08:12:34.567+0700][0.045s][info][safepoint] Safepoint "G1CollectForAllocation", type "GC", cleanup tasks: 3, duration: 255234230 ns, spin: 120000 ns, block: 239850000 ns, sync: 240120000 ns, cleanup: 114000 ns, vmop: 15000000 ns
Let’s break down the timing metrics of this log line:
duration(255.23 ms): The total time the application was paused.sync(240.12 ms): The Time-To-Safepoint (TTSP). This is the time the VM thread spent waiting for all mutators to yield.spin(0.12 ms) &block(239.85 ms): Components of the sync time. The VMThread spins briefly waiting for threads, then blocks.vmop(15.00 ms): The actual duration of the virtual machine operation (in this case, G1 GC allocation phase).cleanup(0.11 ms): Time spent on internal JVM housekeeping (e.g., monitor deflation, symbol table cleanup).
In this example, the GC work only took 15ms, but the application was paused for 255ms. The 240ms sync time is our target. Something is preventing a thread from reaching its safepoint.
If you are using JDK 8, the log output format is structured as a table:
         vmop                    [num:    cond  spin  block  sync cleanup]    time    page_trap_count
12.345: G1CollectForAllocation   [ 42:      0     0    240    240     0    ]     15          0
The sync column here similarly shows 240ms of latency before the 15ms time (vmop execution time) begins.
Step 3: Pinpoint the Culprit Thread using Profilers
Knowing that you have a TTSP bottleneck is only half the battle. You must identify which thread is refusing to pause.
Option A: Using async-profiler
The absolute best tool for diagnosing TTSP issues is async-profiler. It can profile the JVM specifically using the safepoint event. Run the following command during a period of latency spikes:
./asprof -d 30 -e safepoint -f /tmp/safepoint-profile.html [PID]
This profiles your application for 30 seconds. The resulting Flame Graph (safepoint-profile.html) will show the call stacks of the threads that took the longest time to reach a safepoint. The wider the frame in the flame graph, the longer that path was responsible for delaying safepoint synchronization.
Option B: JDK Flight Recorder (JFR)
If you cannot run external native profilers in your production container, use JDK Flight Recorder. Start a recording with the safepoint events enabled:
jcmd [PID] JFR.start name=SafepointAudit settings=profile duration=60s filename=/tmp/audit.jfr
Open /tmp/audit.jfr in JDK Mission Control (JMC). Navigate to JVM Internals -> Safepoints. Look for the following events:
jdk.SafepointBegin: Marks the start of a safepoint phase. Check thesafepointIdandtotalDuration.jdk.SafepointWaitBlocked: Shows which threads took the longest to block. Look at thethreadname and its stack trace at the moment the safepoint was initiated.
Mitigations and Tuning
Once you have identified the root cause of your safepoint latency, apply the appropriate mitigation strategy.
1. Force Safepoints in Counted Loops
If you cannot refactor a long-running counted loop, you can instruct the C2 compiler to preserve safepoint polls inside all counted loops by enabling the UseCountedLoopSafepoints flag:
-XX:+UseCountedLoopSafepoints
Note on performance trade-offs: Inserting safepoint polls into every counted loop adds a tiny runtime overhead to loop execution (usually less than 1-2% throughput reduction). However, this is an excellent trade-off for microservices where stabilizing p99 tail latency is critical.
Alternatively, if you are running on JDK 10+ and want to avoid the global overhead of safepoint polls in loop headers, ensure Loop Strip Mining is active (which is enabled by default when G1 or ZGC is used with -XX:+UseCountedLoopSafepoints). Loop strip mining splits the counted loop into an outer loop and an inner loop, placing the safepoint check only in the outer loop to minimize throughput degradation.
If you are using legacy Java versions where -XX:+UseCountedLoopSafepoints is unstable or unavailable, you can manually force the compiler to treat a loop as uncounted by changing the loop counter from int to long:
// Changing 'int i' to 'long i' forces JIT to insert safepoint polls
for (long i = 0; i < length; i++) {
    result[(int) i] = (byte) (Math.sin(input[(int) i]) * 128);
}
2. Turn Off Biased Locking
If your microservice runs on JDK 8 or JDK 11 and exhibits frequent RevokeBias operations in safepoint logs, disable biased locking entirely:
-XX:-UseBiasedLocking
This will eliminate all safepoints associated with bias revocation, immediately smoothing out latency spikes in multi-threaded application servers.
3. Tune Cleanup Intervals
By default, the JVM periodically initiates a safepoint to perform routine cleanup operations (like deflating idle monitors and flushing code cache). This is controlled by the GuaranteedSafepointInterval parameter, which defaults to 1000 milliseconds (1 second).
If your microservice is completely idle, it will still trigger a safepoint every second. For high-throughput microservices, this constant polling is unnecessary. You can increase this interval or disable it entirely:
-XX:GuaranteedSafepointInterval=0
Setting it to 0 disables the periodic safepoint trigger. The JVM will now only run cleanups during safepoints that are already scheduled by other operations (such as GC cycles), eliminating unnecessary idle pauses.
4. Optimize OS Memory Allocation & Disabling THP
To prevent OS kernel compaction from blocking GC threads during safepoints, configure your Linux production servers to disable Transparent Huge Pages (THP) or set it to madvise.
Check your current configuration in /sys/kernel/mm/transparent_hugepage/enabled:
cat /sys/kernel/mm/transparent_hugepage/enabled
If it is set to [always], disable it by running:
echo madvise | sudo tee /sys/kernel/mm/transparent_hugepage/enabled
Additionally, pass the AlwaysPreTouch flag to the JVM. This forces the JVM to pre-allocate and touch all heap pages during startup, mapping them to physical memory and preventing runtime page faults during GC execution:
-XX:+AlwaysPreTouch
Production Case Study: Resolving a 350ms Latency Spike
Let’s look at a concrete case study from a production environment.
The Problem
A high-throughput Spring Boot microservice running on JDK 11 (G1GC) was processing batches of telemetry data. The service had a throughput of 8,000 RPS. Latency monitoring showed a p99.9 latency of 350ms, while p50 was 3ms.
G1GC logs showed:
[GC pause (G1 Evacuation Pause) (young), 0.0123542 secs]
The actual garbage collection was taking 12ms. However, tracking stopped application times via -XX:+PrintGCApplicationStoppedTime showed:
Total time for which application threads were stopped: 0.3524102 seconds, Stopping threads took: 0.3400120 seconds
The stopping phase (TTSP) was taking 340ms!
The Analysis
We executed async-profiler targeting the safepoint event:
./asprof -d 15 -e safepoint -f /tmp/report.html $(pgrep -f "telemetry-service")
The Flame Graph revealed a massive block of execution in a utility class ProtobufParser.java inside an int-based counted loop that parsed millions of nested proto messages. The JIT compiler had optimized out the safepoint polls from this parsing loop.
The Resolution
We deployed a fix applying three tuning parameters to the JVM startup arguments:
-XX:+UseCountedLoopSafepoints -XX:-UseBiasedLocking -XX:+AlwaysPreTouch
The Results
Following the deployment, the p99.9 latency of the microservice dropped dramatically:
| Metric | Before Tuning | After Tuning |
|---|---|---|
| p50 Latency | 3 ms | 2.8 ms |
| p99 Latency | 45 ms | 8.2 ms |
| p99.9 Latency | 350 ms | 11.5 ms |
| Max TTSP | 340 ms | 0.8 ms |
By restoring safepoint polls to the heavy loops and disabling biased locking, we completely eliminated the tail latency anomalies.
Summary Checklist for Production
When configuring JVM microservices for high throughput and low tail latency, do not rely on default JVM settings. Apply this baseline configuration to your production manifests:
# Stabilize Time-To-Safepoint (TTSP)
-XX:+UseCountedLoopSafepoints
-XX:+AlwaysPreTouch

# Disable deprecated/unnecessary synchronization overhead
-XX:-UseBiasedLocking

# Enable comprehensive safepoint telemetry
-Xlog:safepoint=info,safepoint+stats=debug:file=/var/log/app/safepoint.log:time,uptime,pid:filecount=5,filesize=100M
By proactively monitoring safepoint duration and sync times, you can ensure that JVM internal tasks do not turn into silent performance killers on your production systems.