Debugging HTTP/2 Flow Control Exhaustion: Analyzing gRPC Stream Stalls in Production
An in-depth guide to diagnosing and mitigating silent gRPC stream stalls caused by HTTP/2 flow control exhaustion, featuring production tuning and pprof diagnostics.
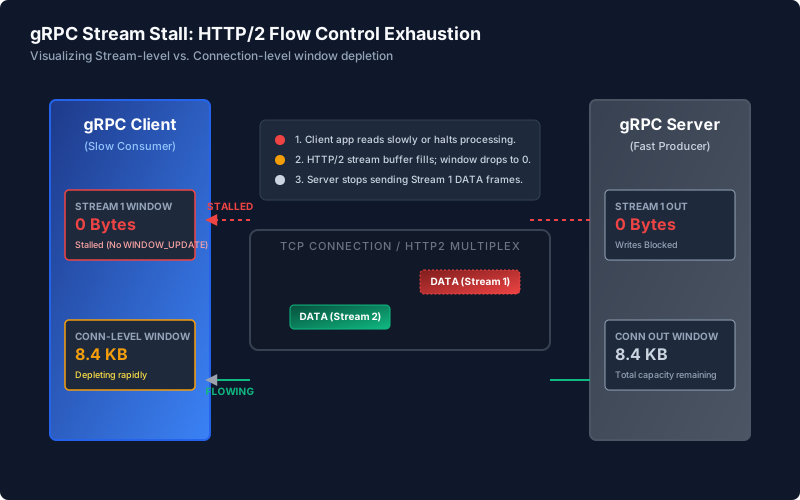
You are running a critical gRPC streaming service processing hundreds of megabytes of telemetry data or ledger transactions per second. Suddenly, tail latencies spike, p99 goes to infinity, and goroutine counts climb steadily. Yet, CPU utilization drops, memory remains stable, and there is no trace of network packet loss. Your streams have stalled silently. This is the classic symptom of HTTP/2 flow control exhaustion. While HTTP/2 multiplexing solves the application-layer Head-of-Line (HoL) blocking of HTTP/1.1, it introduces its own flow-control mechanisms that operate entirely independently of TCP. When a downstream consumer cannot read data fast enough, the server-side write buffers fill up, stream windows collapse to zero, and the write operations block indefinitely, causing thread or goroutine leaks that eventually bring down the entire microservice.
The Mechanics of HTTP/2 Flow Control
To understand flow control exhaustion, we must separate the HTTP/2 transport layer from the underlying TCP transport. TCP uses a sliding window mechanism at the byte stream level, controlled by the kernel’s receive and transmit buffers. HTTP/2, however, is a multiplexed protocol where multiple virtual streams share a single TCP connection. If HTTP/2 relied solely on TCP flow control, a slow reader on Stream A would cause the TCP receive window to shrink, blocking the entire TCP connection and stalling the completely healthy Stream B.
To prevent this, HTTP/2 implements a credit-based flow control mechanism at two distinct layers:
- Stream-level flow control: Prevents a single stream from consuming all buffer space on the connection.
- Connection-level flow control: Limits the total outstanding data multiplexed across all active streams on the TCP connection.
Each direction of transfer (upload and download) is governed by separate flow control windows. When a connection is established, the default initial window size for a stream is set by the SETTINGS_INITIAL_WINDOW_SIZE parameter in the SETTINGS frame. RFC 7540 defines this default value as 65,535 bytes (64 KB - 1).
The sender maintains a flow control window representing the maximum amount of payload data it is permitted to transmit before receiving an update. When the sender transmits a DATA frame, it decrements its local window size by the size of the payload. The receiver, upon reading and processing this data, must explicitly send a WINDOW_UPDATE frame (Type 8) to the sender to replenish the window. If the receiver consumes data slowly, it holds back WINDOW_UPDATE frames. If the sender’s window drops to 0, it must immediately suspend transmitting DATA frames on that stream.
Anatomy of a Stream Stall: The Slow Consumer Scenario
The most common failure mode in production is the “Slow Consumer.” Imagine a client consuming a gRPC server-streaming RPC. The client application reads messages, deserializes them, and submits them to an in-memory queue for worker threads to process.
Here is the chain reaction that occurs when worker throughput drops:
- Queue Saturation: The client’s worker queue fills to capacity, blocking the main read loop of the gRPC client.
- Buffer Fill: The client-side gRPC transport buffer fills up to the configured stream limit (e.g., 65,535 bytes).
- Withholding Updates: Because the client application is not calling
Stream.Recv()or is blocked inside it, the client gRPC transport layer refuses to sendWINDOW_UPDATEframes to the server. - Window Depletion: The server continues to produce data, sending
DATAframes down the wire. With each frame, the server’s tracking of the client’s stream window shrinks. - Zero Window: The server’s stream window hits 0. The server-side gRPC library suspends writing.
- Thread/Goroutine Block: On the server, the goroutine running the handler blocks synchronously inside
stream.Send().
If the client is multiplexing multiple streams on this single connection and the connection-level window is also exhausted, all other streams on that connection—even those with active readers—will stall. This is connection-level head-of-line blocking, and it is a silent killer of throughput in multiplexed microservices.
Diagnostic Playbook: Identifying Flow Control Exhaustion
When a gRPC service stalls due to flow control, traditional metrics like CPU usage, memory, and packet loss are useless. You need a targeted diagnostic playbook to isolate the HTTP/2 layer.
Phase 1: Go pprof and Goroutine Inspection
If your server is written in Go, a thread/goroutine dump will immediately show if handlers are blocked on write operations. Under flow control exhaustion, you will see a large number of goroutines blocked on google.golang.org/grpc/internal/transport.(*http2Server).Write or waiting on transport write queues.
Phase 2: Analyzing TCP Sockets via ss
To rule out raw TCP window exhaustion, use the ss utility on the server. If the server application is blocked on writing, but the TCP Send Queue (Send-Q) is empty or near zero, the bottleneck is not the OS network stack.
If Send-Q is 0 but your goroutines are still blocked on Write, HTTP/2 flow control is the culprit. The TCP socket is perfectly capable of sending bytes, but the HTTP/2 protocol parser on the server is refusing to write because the client has not returned enough flow control credits.
Phase 3: Packet Inspection via tshark
To confirm HTTP/2 flow control window depletion, capture network packets on the server and dissect the HTTP/2 frames. Look for WINDOW_UPDATE frames.
A lack of WINDOW_UPDATE frames (type 8) combined with client-bound DATA frames (type 0) that suddenly cease indicates the stream window is exhausted.
Reproducing the Stall: Concrete Code Example
Below is a minimal, production-grade Go implementation reproducing the stall. The server produces a continuous stream of large messages, while the client artificially delays reading from the stream, simulating a slow downstream pipeline.
The Server Implementation
The Client Implementation
Running this code demonstrates that the server successfully sends the first message (or a small set of messages depending on the internal buffer capacity of the library) and then blocks. The server log will show:
[Server] Attempting to send report 2... and then stop logging until the client finishes its 2-second sleep, processes the first report, and the client gRPC library issues a WINDOW_UPDATE.
Mitigating and Tuning Flow Control
To fix this problem in production, you have three primary leverage points: tuning HTTP/2 window sizes, designing application-level backpressure, and aligning proxy settings.
Tuning gRPC Window Sizes
The default 64KB window size is optimized for low-bandwidth, low-latency environments. For modern high-performance microservices, this default limits performance due to the Bandwidth-Delay Product (BDP).
\[BDP = \text{Bandwidth} \times \text{RTT}\]For example, on a 10 Gbps network with a 2ms round-trip time (RTT):
\[BDP = 1.25\text{ GB/s} \times 0.002\text{s} = 2.5\text{ MB}\]If your window size is smaller than the BDP, the sender will stall waiting for WINDOW_UPDATE frames, leaving your available bandwidth underutilized.
To resolve this, scale up your stream and connection windows. In Go, use InitialWindowSize and InitialConnWindowSize.
On the client side, apply matching settings:
[!WARNING] Do not make window sizes arbitrarily large. The window size represents the maximum amount of unconsumed data the server or client is willing to buffer in RAM per connection/stream. If you configure a 32MB connection window and support 1,000 concurrent client connections, your service may allocate up to 32GB of memory just for transport buffering, risking Out-Of-Memory (OOM) kills.
Application-Level Backpressure
Tuning window sizes only shifts the bottleneck; it does not eliminate it. If the producer is permanently faster than the consumer, the buffers will still fill up, and the streams will still stall.
To solve this, implement application-level backpressure using a decoupled worker pool with explicit queue sizing and drop policies, or a rate-limiter feedback loop. The client should monitor its queue depth. If the queue crosses a high-water mark, it can either drop messages (if loss is acceptable), apply rate limits, or notify the server to slow down using an application-level control channel.
Aligning Proxy Settings (Envoy / Ingress)
If your architecture uses a service mesh (like Linkerd or Istio) or an edge proxy (like Envoy), you must align the proxy’s HTTP/2 protocol settings with your backend configuration.
If Envoy is configured with default HTTP/2 flow control settings (typically 65,535 bytes), it will limit your pipeline even if both your backend server and client have been configured with 4MB windows. Envoy will accumulate bytes from the server, run out of downstream flow control credit, and stop reading from the upstream server.
Here is the configuration block required to tune downstream and upstream HTTP/2 window sizes in an Envoy listener and cluster setup:
Summary of Diagnostic and Mitigation Steps
When diagnosing gRPC stream stalls in production:
- Check for blocked writers using stack profiling (
pprof). Look for calls to transport write queues. - Monitor TCP queues via
ss -t -i. IfSend-Qis near 0 but the stream is blocked, the issue lies in the HTTP/2 flow control window. - Verify the frame exchange with
tshark. Look for streams lackingWINDOW_UPDATEframes. - Calculate your network’s Bandwidth-Delay Product (BDP) and scale up client/server
InitialWindowSizeandInitialConnWindowSizeto match. - Align your proxy’s HTTP/2 configurations with Envoy’s protocol options to prevent the proxy from becoming a flow control bottleneck.