Debugging CPU Throttling and CFS Bandwidth Control Issues in High-Throughput Go Containers Running on Kubernetes
A deep dive into identifying, debugging, and resolving CFS CPU throttling and GOMAXPROCS mismatches in high-throughput Go microservices on Kubernetes.
You deploy a high-throughput Go microservice to Kubernetes, provisioned with a CPU limit of 4 cores. Under load, average CPU utilization hovers around a comfortable 40%, yet your P99 latency chart looks like a saw-tooth pattern, spiking past 100 milliseconds. Clients report connection timeouts, and your health checks occasionally fail, prompting Kubernetes to restart the pod. If this sounds familiar, you are likely suffering from Completely Fair Scheduler (CFS) bandwidth throttling—a silent performance killer caused by a fundamental mismatch between the Go runtime’s concurrency engine and how Linux cgroups enforce CPU limits.
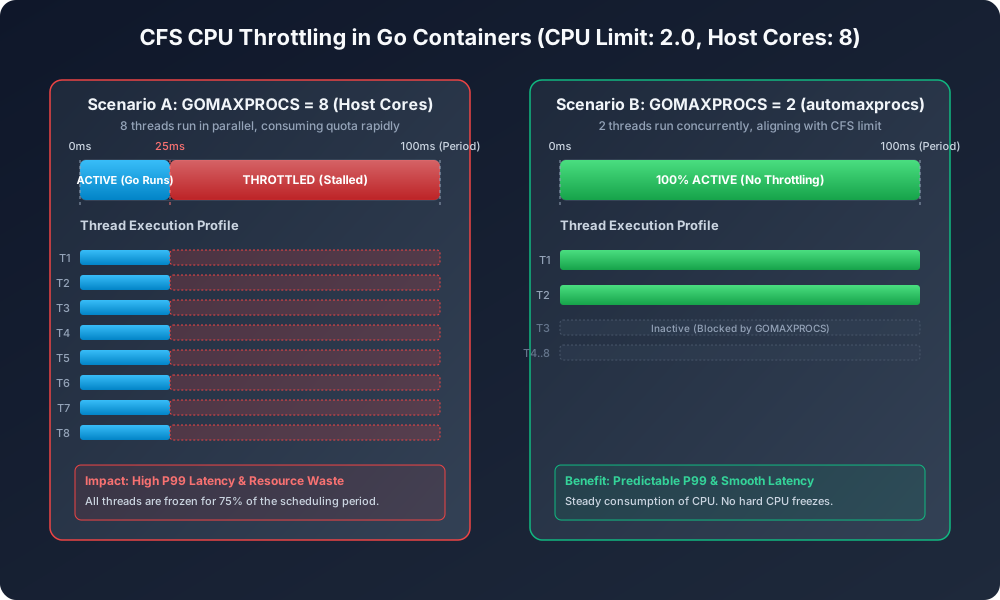
The Mechanics of CFS Bandwidth Control and Go’s Scheduler
To understand why this throttling occurs, we have to look at the intersection of two scheduling systems: the Go runtime scheduler (the G-M-P model) and the Linux kernel’s Completely Fair Scheduler (CFS) bandwidth control.
The Linux CFS Bandwidth Control Model
Kubernetes enforces CPU limits using the CFS bandwidth control mechanism in cgroups. CFS works by dividing time into discrete slices called periods (configured via cpu.cfs_period_us, which defaults to 100,000 microseconds, or 100ms).
When you set a CPU limit on a container, you define a quota (cpu.cfs_quota_us). For example, a limit of 2.0 CPUs translates to a quota of 200,000 microseconds (200ms) per 100ms period. The quota is a global pool shared by all threads inside the container.
- At the beginning of each 100ms period, the cgroup is allocated its quota of 200ms.
- Whenever a thread in the container runs, it deducts its elapsed CPU execution time from this global quota pool.
- If the quota pool reaches 0 before the 100ms period is up, all threads in the container are immediately frozen (throttled).
- The threads remain frozen until the next period begins and the quota pool is refreshed.
The Go Runtime Scheduler (G-M-P)
Go manages concurrency using its own runtime scheduler:
- G (Goroutine): The lightweight thread of execution.
- M (Machine/OS Thread): The actual operating system thread managed by the kernel.
- P (Processor): A logical context required to execute Go code. The number of active logical processors is controlled by
GOMAXPROCS.
By default, the Go runtime initializes GOMAXPROCS to the number of logical CPUs visible to the operating system. It achieves this by calling runtime.NumCPU().
Herein lies the fatal mismatch. In a containerized environment, runtime.NumCPU() does not read the container’s cgroup CPU limit; instead, it reads the count of online CPUs on the underlying physical host or virtual machine hypervisor.
If you deploy a container with a CPU limit of 2.0 onto a bare-metal Kubernetes node running a 64-core AMD EPYC processor, the Go runtime will set GOMAXPROCS to 64.
The Physics of Throttling
When a request spike arrives, Go’s scheduler attempts to utilize all available capacity. It distributes goroutines across 64 logical P contexts, spawning 64 OS threads (M) to execute them in parallel on the host.
Let’s look at the math:
- The container has a CPU limit of
2.0cores, meaning a quota of 200ms per 100ms period. - The Go runtime runs 64 threads concurrently.
- If all 64 threads execute Go code at the same time, they will consume the 200ms quota in exactly: \(\text{Time to exhaust quota} = \frac{200\text{ ms}}{64} = 3.125\text{ ms}\)
- Within just 3.125ms of wall-clock time, the container exhausts its entire cgroup CPU quota.
- The Linux kernel freezes the container for the remaining 96.875ms of the scheduling period.
During this 96.875ms freeze, your application cannot process packets, execute garbage collection, or respond to Kubernetes liveness probes. To external systems, your container has vanished.
Let’s look at a typical misconfigured Kubernetes deployment specification.
Production Symptoms: The “Stuttering” Pod
CFS throttling is notoriously difficult to diagnose if you are only looking at standard APM metrics or average CPU utilization dashboards.
Why Average CPU Metrics Lie
A container that is severely throttled can report a low average CPU utilization. For example, if a pod is active for 5ms of every 100ms period, using all 64 host cores, it consumes $64 \times 5\text{ ms} = 320\text{ ms}$ of CPU time. Over a 100ms period, that is $3.2$ cores worth of compute. If the limit is 4 cores, the metrics show the container is using 80% of its limit ($3.2 / 4.0$).
However, the container was completely frozen for 95% of the time. Average CPU metrics look healthy, but your application is practically unresponsive.
Classic Indicators of CFS Throttling
- Saw-tooth P99 Latency: P99 latencies will cluster around values slightly larger than 100ms (or multiples thereof, like 200ms or 300ms), representing the duration of one or more CFS periods spent frozen.
- Readiness Probe Failures: Under load, you will see
Readiness probe failed: Get "http://...": context deadline exceededin your Kubernetes event log. - TCP Connection Reset & SYN Drops: Clients will report connection resets or high connection establishment times because the socket backlog fills up while the container is frozen.
- Elevated GC Pause Times: Go’s garbage collector relies on background workers. If these workers are throttled mid-cycle, GC pauses that normally take 1ms can stretch to 100ms+, causing severe memory growth.
To see what NumCPU() returns compared to the active threads, look at this simple test routine:
If you run this code inside a container on a 32-core node with a limit of 2 CPUs, it will print:
NumCPU: 32, GOMAXPROCS: 32.
Diagnosing Throttling from the Command Line
When you suspect a pod is being throttled, you should inspect the cgroup statistics directly on the container filesystem. The Linux kernel exposes cgroup metrics inside /sys/fs/cgroup. Depending on your Kubernetes cluster’s container runtime and OS version, you will be using either cgroups v1 or cgroups v2.
Cgroups v1 Paths
- CFS Period:
/sys/fs/cgroup/cpu/cpu.cfs_period_us - CFS Quota:
/sys/fs/cgroup/cpu/cpu.cfs_quota_us - Throttling Stats:
/sys/fs/cgroup/cpu/cpu.stat
Cgroups v2 Paths
- CFS Limits:
/sys/fs/cgroup/cpu.max(contains both quota and period in a single line, e.g.,200000 100000) - Throttling Stats:
/sys/fs/cgroup/cpu.stat
Let’s write a robust diagnostic script that can be executed via kubectl exec to check the current throttling rate of a running Go container.
In the output of cpu.stat, look for three primary keys:
nr_periods: The total number of scheduling periods that have elapsed.nr_throttled: The number of periods in which the container exhausted its quota and was throttled.throttled_time: The cumulative time (in nanoseconds) for which the container’s threads were frozen.
If the ratio of nr_throttled to nr_periods exceeds 5%, your application is experiencing significant throttling that will negatively impact P99 latencies.
Prometheus Alerts: Catching CFS Throttling in the Wild
Manually executing scripts inside containers is not viable at scale. You must monitor throttling continuously using Prometheus and Grafana. The cadvisor daemon, which runs on every Kubernetes node, exposes cgroup metrics via the /metrics endpoint.
You can calculate the percentage of periods that are throttled using the following metrics:
container_cpu_cfs_periods_total: Total elapsed CFS periods.container_cpu_cfs_throttled_periods_total: Number of throttled CFS periods.
Here is a production-ready Prometheus Alerting Rule to detect when containers are actively throttled.
The Solution: Aligning GOMAXPROCS with Container Limits
There are two primary ways to align the Go runtime scheduler with cgroup limits: manually setting the GOMAXPROCS environment variable, or using a self-configuring library like Uber’s automaxprocs.
Method 1: The Manual GOMAXPROCS Environment Variable
You can calculate the required GOMAXPROCS based on your container’s CPU limit and pass it as an environment variable in the pod specification. For instance, if your CPU limit is 4, you set GOMAXPROCS=4.
However, this approach is error-prone. If your platform team adjusts the CPU limits in the Helm values files but forgets to update the environment variable, you will recreate the mismatch.
Method 2: Uber’s automaxprocs Library
The standard solution is to import go.uber.org/automaxprocs in your application’s entrypoint (main.go). This library inspects the active cgroup configuration on startup, parses the limits, and overrides GOMAXPROCS automatically.
Here is how to integrate automaxprocs into a production Go microservice.
When this application boots up, automaxprocs scans /sys/fs/cgroup and prints the following log line:
maxprocs: Leave GOMAXPROCS=2: using container limits
By reducing the active execution threads (M) to match the allocated CPU capacity, Go’s scheduler no longer overwhelms the kernel’s cgroup quota allocator. CPU utilization remains smooth, and P99 latency drops back to baseline.
The Pitfalls of Fractional CPUs and Custom CPU Periods
While automaxprocs solves the default thread mismatch, senior engineers must watch out for edge cases involving fractional limits and custom scheduler periods.
Handling Fractional CPU Limits
Kubernetes permits fractional CPU limits (e.g., requests.cpu: 1500m, which translates to 1.5 cores).
When automaxprocs parses a fractional CPU limit, it must resolve it to an integer. By default, it applies a rounding strategy.
- If you allocate
1.5cores,automaxprocsrounds up to2. - This means 2 threads can execute concurrently. While this is far better than spawning 64 threads, it still means that if both threads run at 100% capacity, they will consume 2.0 cores of quota. Since your limit is 1.5 cores, the container will still experience a minor amount of throttling toward the end of each period.
To avoid this, try to set integer CPU limits for high-throughput, latency-sensitive Go containers (e.g., 2, 4, 8).
Custom Fallbacks for Raw Containers
If you run workloads on platforms where /sys/fs/cgroup paths are mounted differently, or if you want a reliable fallback that doesn’t import external dependencies, you can write a manual GOMAXPROCS initializer that checks environment variables and provides a ceiling calculation.
To Limit or Not to Limit: The Architectural Debate
A growing trend among platform engineers running massive Kubernetes clusters is to omit CPU limits entirely (limits.cpu: null) while keeping CPU requests high.
The Argument for No CPU Limits
Without CPU limits, CFS bandwidth control is never activated for that cgroup. Your container can burst to use any idle CPU capacity on the node without the risk of being throttled. This completely eliminates P99 latency spikes caused by quota exhaustion.
If the node becomes congested, the Linux kernel uses CPU shares (derived from the Kubernetes requests.cpu) to allocate CPU time proportionally. Under contention:
- A pod with
requests.cpu: 2will receive twice as much CPU time as a pod withrequests.cpu: 1. - No pod is frozen; instead, they all experience progressive degradation as they compete for cycles.
The Risks of No CPU Limits
While eliminating limits prevents CFS throttling, it introduces other operational failure modes:
- Unpredictable “Noisy Neighbors”: A single misbehaved pod running an infinite loop can consume all idle capacity on a node, impacting other pods that rely on bursting.
- Poor Capacity Planning: It becomes significantly harder to calculate node utilization and auto-scaling rules when containers are allowed to consume unlimited resources.
- Noisy Heap Allocations: Go garbage collection scales its intensity based on how fast memory is allocated. Unlimited CPU can lead to fast allocations that trigger rapid memory growth, occasionally causing the node to run out of memory (OOM).
Recommended Best Practice
For high-throughput, latency-critical Go microservices:
- Set requests equal to limits (Guaranteed QoS class) if you require deterministic performance (e.g.,
requests.cpu: 4,limits.cpu: 4). - Always integrate
automaxprocsor explicitly defineGOMAXPROCSto match the limits. - Avoid fractional core configurations where possible to eliminate rounding mismatches.
- Monitor your throttling ratios via Prometheus and increase CPU allocations if your throttled period percentage rises above 5%.