Correlating eBPF Socket Event Tracing with OpenTelemetry Context in Distributed Environments
Bridge the visibility gap between kernel-level networking and user-space traces by parsing W3C headers in eBPF and mapping TCP metrics to OpenTelemetry spans.
A p99 latency spike of 500ms hits your core checkout service. Your OpenTelemetry (OTel) traces indicate that a downstream HTTP request took 505ms, yet the downstream microservice logs claim it processed the incoming request in only 3ms. Traditional tracing stops at the user-space boundary, leaving you completely blind to the remaining 502ms. Was it connection pool starvation in your client? Was it TCP handshake queueing (backlog overflow) on the target host? Or was it silent packet loss triggering TCP retransmission timeouts at the hypervisor level? In high-throughput distributed systems, resolving these low-level network anomalies is a persistent challenge because user-space instrumentation cannot capture kernel-space state. By injecting eBPF hooks into socket system calls and correlating those kernel-level events directly with W3C Trace Context headers, we can map network-layer metrics (like TCP round-trip time, packet retransmissions, and socket queue delays) directly to the specific application spans that suffered from them.
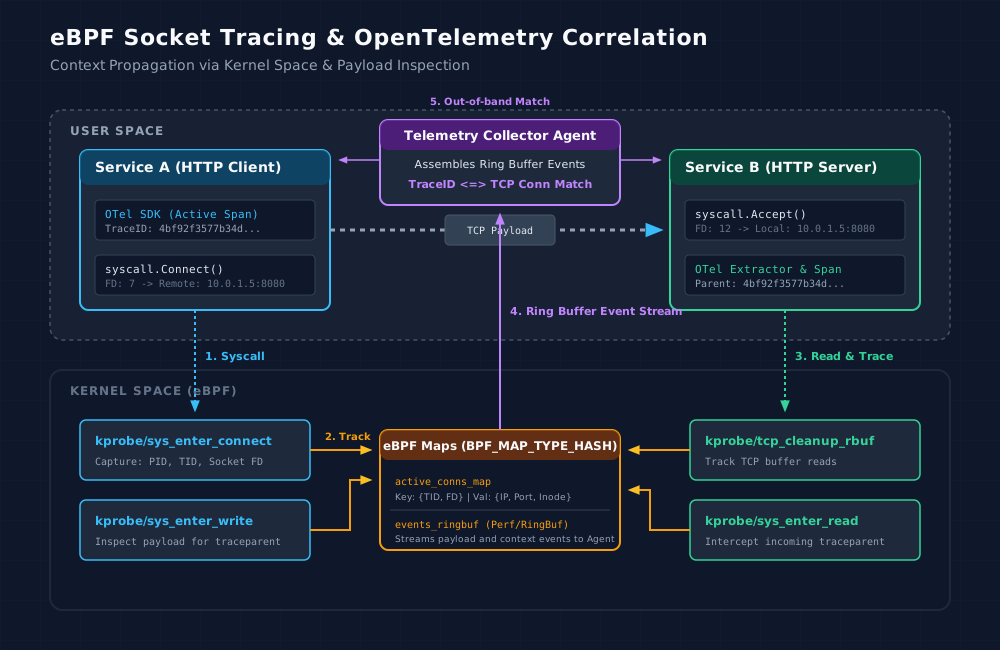
The Observability Gap: Where User-Space Tracing Falls Blind
Standard OpenTelemetry instrumentation hooks into application runtimes (such as Go’s net/http or Java’s HttpServlet) in user space. It starts a span before the application formats an HTTP request, and ends the span after the response is read.
However, the journey of an HTTP request from one service to another is managed entirely by the kernel. When a user-space application calls http.Client.Do(), the request passes through several kernel layers:
- Socket Allocation & Connection: The runtime checks the connection pool. If empty, it triggers
sys_connectto initiate a TCP handshake. If the downstream server’s listen queue is full, the SYN packet is dropped silently, leading to a exponential backoff delay (often 1 second or more) before retrying. - TCP Send Buffer Queueing: The application writes data via
sys_writeorsys_sendto. The data is queued in the socket’s write buffer. If the congestion window (cwnd) is saturated or the network is congested, the data sits in the kernel queue, delaying transmission. - Device Driver Queueing (qdisc): The kernel schedules packets via the queuing discipline (qdisc) before feeding them to the network interface card (NIC) ring buffer. High CPU contention or misconfigured QoS queues can introduce queueing delays here.
Because user-space OTel SDKs have no visibility into the kernel socket buffers or the TCP state machine, any latency incurred in these steps is rolled into the duration of the parent span. The engineer looking at the trace blames the downstream service for slowness, while the downstream service never even received the request until hundreds of milliseconds later.
To bridge this gap, we must correlate eBPF-derived network metrics directly with user-space trace context. We can achieve this by parsing the W3C traceparent header directly from the network payload in kernel space and mapping it to the connection’s TCP 4-tuple.
The Core Architecture of eBPF-OTel Correlation
To correlate eBPF network metrics with OTel spans, our telemetry architecture needs to perform three distinct tasks:
- Syscall Interception: Hook socket writes and reads to parse W3C Trace Context headers (
traceparent) and map them to specific socket file descriptors and thread IDs. - TCP State Tracking: Monitor TCP retransmissions, round-trip time (RTT), and queue depths on the mapped sockets.
- Out-of-Band Association: Stream these kernel-space events via an eBPF Ring Buffer to a user-space agent, which correlates them with active OpenTelemetry spans using the TraceID and SpanID.
Goroutine Context Challenge in Go Applications
In runtimes like Java or C++, threads map 1-to-1 to OS threads. If a thread creates an OTel span and then makes a socket call, we can trace the socket syscall back to that thread using bpf_get_current_pid_tgid().
In Go, the runtime schedules thousands of goroutines onto a small pool of OS threads (M structures). A goroutine can yield its thread (e.g., during network I/O or channel operations) and resume on a different OS thread. Because of this, thread ID (TID) correlation is highly unreliable in Go.
To build a robust, runtime-agnostic correlation mechanism, we must inspect the TCP payload itself inside eBPF. Since HTTP requests (including gRPC over HTTP/2) carry the W3C traceparent header in their headers, we scan the socket write buffer for this specific byte sequence. When found, we bind the TraceID and SpanID to the socket’s 4-tuple (Source IP, Source Port, Dest IP, Dest Port). Any subsequent TCP events on that socket can then be attributed back to that trace context.
Intercepting Socket Payloads with eBPF kprobes
To intercept socket payloads, we attach kprobes to tcp_sendmsg and tcp_cleanup_rbuf (or hook syscalls like sys_write and sys_read). We target tcp_sendmsg because it is protocol-specific and provides direct access to the struct sock containing the TCP connection parameters and the struct msghdr containing the application payload.
Here is the implementation of our eBPF kernel program in C that intercepts tcp_sendmsg to extract the socket’s 4-tuple and prepares to inspect the payload.
Parsing W3C Trace Headers in Kernel Space
The W3C Trace Context standard defines the traceparent header as a single hyphen-delimited string containing four fields:
version-trace_id-parent_id-trace_flags
Example header value:
00-4bf92f3577b34da6a3ce929d0e0e4736-00f067aa0ba902b7-01
To parse this payload in eBPF, we must scan the raw socket memory buffers. Because the eBPF verifier enforces strict limits on loop executions and pointer arithmetic to prevent kernel panic conditions, we must write a highly optimized, bounded helper function.
Below is the helper function designed to scan a memory buffer, find the substring "traceparent:" or "traceparent", and extract the hex-encoded TraceID and SpanID into a binary structure.
Now we integrate this helper back into our tracing flow. We add a return probe (kretprobe) on tcp_sendmsg to intercept the output buffer, extract the W3C header details, and match them to the socket connection data stored by our active connection tracker.
User-Space Control Loop: The Go eBPF Loader & Collector
To load our eBPF program, attach kprobes to system calls, and stream the generated socket telemetry data, we write a Go application using the cilium/ebpf library.
This user-space daemon acts as the bridge. It reads binary payloads from the BPF Ring Buffer, decodes the IP tuples and parsed W3C headers, and writes them to a thread-safe local cache for trace enrichment.
Correlating Kernel Events with OpenTelemetry Spans
Once our daemon receives the socket events, we must merge them into our OpenTelemetry span pipelines.
In Go, we can write a custom OpenTelemetry SpanProcessor. When a span is completed, the processor checks our local shared eBPF event cache using the TraceID and SpanID. If a matching socket event exists, we copy the kernel metrics (like TCP RTT) onto the span attributes.
Managing Production Overhead and Filtering
Executing payload inspections and calling helper functions on every network write is highly resource-intensive. If your microservices process tens of thousands of requests per second, running string matching on every packet will consume significant CPU cycles and degrade throughput.
To keep eBPF CPU overhead below 1%, we must apply strict filtering at the earliest point in our kernel probe:
- Target PID Filtering: Ignore system daemons, logs, database backends, and other infrastructure processes that do not emit traces.
- Port/CIDR Filtering: Restrict tracing to defined HTTP/gRPC ingress and egress traffic ports (e.g.
80,443,8080,50051). - Control Maps: Maintain these filters inside eBPF maps that user-space dynamically updates.
Below is the optimized filtering logic in C to exclude untargeted network traffic before parsing the payload.
Real-World Production Failure Modes Solved
Let’s look at how correlating eBPF network metrics with OpenTelemetry traces resolves complex production issues.
Scenario A: The Silent TCP Retransmission Storm
An API gateway makes a downstream call to an authentication service. The HTTP span shows the authentication call takes exactly 1002ms. The authentication service’s local spans show its processing took only 2ms.
Because we have eBPF telemetry mapped directly to the trace ID, our exporter records a kprobe/tcp_retransmit_skb event on the socket holding the trace context.
Reviewing the correlated metrics reveals:
- Span Name:
POST /v1/auth - Span Duration:
1002ms - eBPF Attributes:
network.kernel.rtt_us:150(0.15ms)network.kernel.retransmits:3network.kernel.retransmit_backoff_ms:1000
The eBPF trace proves the network link was healthy (0.15ms RTT), but a sudden drop of the TCP SYN-ACK packet forced the gateway’s socket to enter TCP retransmission backoff, delaying the request by exactly 1000ms. The network engineer traces the loss to a virtual switch buffer overflow on the hypervisor hosting the API gateway.
Scenario B: TCP Ingress Backlog Drops
During traffic surges, p99 latency increases across all HTTP spans. Downstream services do not show increased database latency or thread pool exhaustion.
Our correlated telemetry shows:
- Span Name:
GET /orders - Span Duration:
2005ms - eBPF Attributes:
network.kernel.socket_backlog_drops:15network.kernel.connection_handshake_wait_ms:2001
At the kernel level, the downstream service’s listen backlog was saturated. The kernel dropped incoming TCP connection requests (SYNs). The client’s socket queued the request in user-space while waiting for the connection to complete, consuming 2000ms in the TCP handshake phase.
To fix this, we update the service configuration to increase the Unix socket listen backlog (somaxconn) and match the application server’s acceptance backlog.
Ingestion Pipeline Integration
To collect these metrics and make them queryable, we configure the OpenTelemetry Collector. The collector ingests trace records from application runtimes and merges them with network events sent by our eBPF collector agent.
# // snippet-7
receivers:
  otlp:
    protocols:
      grpc:
        endpoint: 0.0.0.0:4317
      http:
        endpoint: 0.0.0.0:4318

  # Custom receiver collecting matched eBPF socket events
  forwarder/ebpf:
    endpoint: 127.0.0.1:9090

processors:
  batch:
    timeout: 1s
    send_batch_size: 256

  # Correlate traces and eBPF system metrics by TraceID
  spanmetrics:
    metrics_exporter: prometheus
    latency_histogram_buckets: [100us, 1ms, 5ms, 10ms, 100ms, 250ms, 500ms, 1s, 5s]
    dimensions:
      - name: network.kernel.rtt_us
        default: "0"

exporters:
  otlp/tempo:
    endpoint: tempo:4317
    tls:
      insecure: true
  prometheus:
    endpoint: 0.0.0.0:8889

service:
  pipelines:
    traces:
      receivers: [otlp]
      processors: [batch]
      exporters: [otlp/tempo]
    metrics:
      receivers: [otlp, forwarder/ebpf]
      processors: [spanmetrics, batch]
      exporters: [prometheus]
Production Guardrails: Overhead and Safety
When deploying eBPF tracers to production systems, prioritize safety and overhead management:
- Verifier Limitations: The kernel verifier rejects programs with unsafe memory references, potential null pointers, or unbounded loops. Always compile your eBPF programs using modern toolchains (like LLVM/Clang) and use helper functions (like
bpf_probe_read_user) to guarantee memory safety. - Kernel Compatibility: System call signatures change across kernel versions. For example,
struct msghdrinternals were refactored in kernel 5.x. Test your instrumentation scripts on kernel versions matching your target production environments, or adopt CO-RE (Compile-Once Run-Everywhere) strategies using BTF (BPF Type Format). - TLS encrypted traffic: Intercepting socket payloads in kernel-space reads raw bytes. If your services use HTTPS or gRPC over TLS, the kernel-level buffer contains encrypted ciphertext. In this scenario, raw string matching on
"traceparent"will fail. To trace encrypted links:- Attach uprobes to TLS libraries (like
libssl.so,libcrypto.so, or Go’scrypto/tlsruntime functions) to extract the trace headers in user-space before encryption occurs. - Or, map the trace ID out-of-band by tracking the Thread ID (TID) immediately before the thread makes the TLS library calls, matching it to the active socket file descriptor.
- Attach uprobes to TLS libraries (like
By combining the context propagation of OpenTelemetry with the kernel-level visibility of eBPF socket tracing, you can eliminate network blind spots and diagnose complex connection, routing, and queueing delays across your distributed infrastructure.