Correlating eBPF Network Metrics with OpenTelemetry Traces in Kubernetes
Bridge the observability gap between kernel-space TCP metrics and L7 application traces using eBPF and OpenTelemetry.
You are troubleshooting a sudden P99 latency spike in your Kubernetes-based microservices mesh. The distributed tracing dashboard displays a clear anomaly: Service A’s HTTP client span reports a 2.5-second duration, yet Service B’s handler span claims it processed the request and returned a response in just 12 milliseconds. The remaining 2.48 seconds are completely unaccounted for. Is it connection pool starvation? Socket buffer tail-drop on a congested worker node? TCP retransmissions caused by packet loss in the Calico overlay? Or standard DNS resolution degradation? Traditional distributed tracing stops at the L7 boundary, leaving a critical observability gap within the Linux kernel network stack. By leveraging eBPF (Extended Berkeley Packet Filter) to capture socket-level metrics (such as TCP RTT, cwnd, and packet retransmissions) and correlating them directly with OpenTelemetry Trace IDs, you can finally bridge the gap between kernel-space network dynamics and application-level execution.
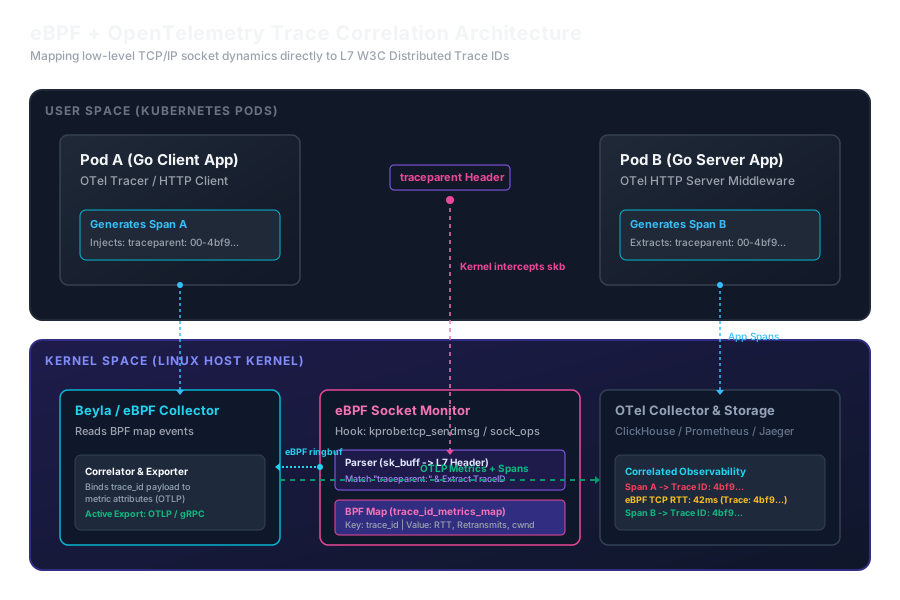
The Observability Gap: Kernel vs. User Space
Modern observability stacks rely heavily on L7 distributed tracing. Developers instrument their applications with OpenTelemetry SDKs, propagating a trace context—specifically the W3C traceparent header—across HTTP, gRPC, and message broker boundaries. This context mapping builds a dependency tree showing how requests traverse services.
However, the network transmission itself is treated as a black box. Once an application hands a payload to the socket via the sys_write or sys_sendto system calls, the execution transfers to the Linux kernel. The kernel processes the data through the TCP/IP stack, queues it in the socket buffer (sk_buff), encapsulates it, handles routing, and finally passes it to the network interface card (NIC) driver.
If packet drops occur on a congested virtual ethernet interface (veth), or if a TCP handshake is delayed due to syn backlog queue saturation, the application-level tracing SDK remains entirely unaware. It merely records a generic network timeout or high latency. eBPF provides the mechanism to inspect these kernel-space transitions without code modification. But to make eBPF metrics actionable, they must be matched with trace context.
Correlation Strategies: Inline Parsing vs. Connection Mapping
There are two primary patterns for correlating eBPF network metrics with OpenTelemetry traces in production Kubernetes clusters:
- L7 Inline Header Parsing (Context-Aware eBPF)
An eBPF program hooks into socket operations (
sock_opsor Traffic Controltc_clsactclassifiers) and inspects the payload buffer. It parses HTTP or gRPC headers, extracts thetraceparentvalue on the wire, and saves the mapping between the connection’s TCP state (RTT, retransmits, window size) and the activetrace_idin a BPF map. - Offline Join via Connection Tuples (Metadata Alignment)
Instead of parsing payloads in kernel space—which can be CPU-intensive and fails under TLS encryption—the application spans and the eBPF network metrics are collected separately but tagged with identical metadata. Both the application tracing library and the eBPF system record the connection 5-tuple:
(Source IP, Source Port, Destination IP, Destination Port, Protocol)along with highly precise timestamps. These logs and metrics are then joined in a backend data store like ClickHouse.
Let’s examine how to implement both approaches.
Deep Dive: Building a Trace-Aware eBPF Network Monitor
To correlate TCP metrics with L7 trace headers directly in the kernel, we attach an eBPF program to socket write events. The following C code demonstrates a kernel hook that parses outgoing TCP traffic, identifies the HTTP traceparent header, and registers TCP metrics linked to that Trace ID inside a BPF map.
This eBPF program tracks TCP connection characteristics directly within the socket operations lifecycle. Next, a user-space driver written in Go must load this program, consume events, and format them into OpenTelemetry metric payloads.
Context Correlation: Leveraging Connection 5-Tuples
While L7 payload analysis in eBPF works well for plain-text protocols, it becomes problematic for TLS encrypted communication (e.g., HTTPS, secure gRPC). To resolve this limitation in production, you must correlate connection metadata collected by application middleware with network data collected by eBPF.
To implement this workflow, application trace spans must record their exact network connection properties. The following HTTP middleware intercepts outbound Go HTTP client requests, captures local/remote IP and ports, and appends them directly to the active span.
With this middleware running in our microservices, every L7 span contains the connection 5-tuple. Concurrently, an eBPF network exporter like Cilium Hubble or OpenTelemetry Beyla monitors kernel-level flows, outputting connection data with the same socket metadata.
OpenTelemetry Collector Pipelines
To assemble this telemetry at scale, you configure an OpenTelemetry Collector. The collector aggregates spans from application runtimes and TCP metrics from eBPF agents, routing them to a unified storage engine.
To capture this kernel trace data, we run eBPF agents as a DaemonSet on every Kubernetes worker node. Using OpenTelemetry Beyla, we auto-instrument Kubernetes workloads at the kernel layer. Here is a production-grade manifest deployment configuration:
Running Correlated Queries in ClickHouse
Once traces and eBPF metrics are ingested into ClickHouse, we run analytical joins to debug network behavior. If a service calls a peer and experiences long latencies, we correlate those L7 spans with low-level kernel metrics via the connection tuple and the timestamp.
This query correlates data from both domains. By performing a temporal join on the exact IP and port tuples, you isolate which long-running requests were caused by host-level network degradation (high RTT or packet drops) versus application bottlenecks (garbage collection or lock contention).
Real-World Failure Modes Solved by eBPF Correlation
Deploying eBPF correlation in production helps resolve specific, hard-to-diagnose infrastructure failure modes:
1. Silent Overlay Drops (MTU Mismatch)
- Symptom: Service A successfully connects to Service B, but transferring larger payloads (e.g. 50KB JSON responses) causes HTTP requests to hang and time out after 30 seconds. Trace duration matches the client timeout, but server spans show fast response times.
- eBPF Analysis: Correlation shows normal TCP round-trip times during connection setup, but high numbers of TCP retransmissions (
retransmits > 5) precisely when the payload is sent. This points to packet drops due to MTU configuration issues in the overlay network (e.g. VXLAN or Geneve adding encapsulation overhead without matching interface configuration).
2. Node Socket Buffer Congestion
- Symptom: A P99 response time spike of 3.2 seconds is observed across all pods residing on a single Kubernetes node.
- eBPF Analysis: Correlated traces show a sharp rise in kernel queue latency, while application handler code execution remains unchanged. Checking
tc_clsactmetrics shows that the host node’s network interface socket queue limit was saturated, causing the kernel to drop incoming packets before they reached the pod namespace.
3. Connection Pool Exhaustion and TCP Syn Backlog
- Symptom: Application trace spans record a long connection setup time (
http.client.connect), but the backend server shows no request traffic until seconds later. - eBPF Analysis: By joining kprobe trace events on
tcp_v4_conn_request, you see a spike in connection request drops. The server pod’s SYN backlog queue is full, causing the kernel to silently ignore incoming SYN packets and forcing the client to retransmit them at exponential backoff intervals (1s, 3s, etc.).
Practical Production Considerations
When implementing eBPF network trace correlation, consider the following performance and security constraints:
- Kernel Version Dependencies: eBPF programs utilizing socket operations (
BPF_PROG_TYPE_SOCK_OPS) require modern Linux kernels (v4.18+ or v5.4+). In multi-tenant environments, verify host kernels support BTF (BPF Type Format) to avoid running compiler pipelines on every target node. - CPU Overhead: Parsing Layer 7 headers directly within kernel space can introduce latency under high throughput. Restrict parsing to the first packet of a connection, or use metadata alignment (offline joins via ClickHouse) to offload correlation logic from the packet path.
- Encrypted Network Traffic: If pods communicate using mTLS via an Istio or Linkerd sidecar, L7 payload parsing will see only encrypted data. Use connection 5-tuple metadata mapping or attach your eBPF programs to OpenSSL userspace probes (
uprobes) within application processes. - Privileged Execution: eBPF agents require
CAP_SYS_ADMINorCAP_BPFprivileges in Kubernetes. Ensure your container runtimes and security policies allow runtimes to execute kernel-level helper functions safely.