Correlating Distributed Tracing and System Metrics: Auto-Injecting eBPF Socket-Level Latency into OpenTelemetry Spans
Inject kernel-level TCP socket latency and retransmissions into OpenTelemetry spans using eBPF, unmasking hidden network tax in production.
Every senior backend engineer has faced the “silent network tax” in production: a database query span in your distributed tracing UI shows a flat 250ms duration, but the database server’s slow query log insists the query finished in exactly 1.2ms. Your application code is doing a blocking socket read, and as far as the OpenTelemetry (OTel) SDK is concerned, that entire 248.8ms was spent waiting for the database to process the query. In reality, the packet spent 150ms sitting in a container network interface (CNI) virtual queue, another 80ms undergoing TCP packet retransmissions over a congested virtual switch, and 18ms waiting for a CPU context switch in a heavily throttled container. Traditional user-space APM tracing is completely blind to the kernel-level reality of the Linux network stack. By leveraging eBPF (Extended Berkeley Packet Filter) to trace socket-level events and auto-injecting them in real-time into OpenTelemetry spans, we can bridge this visibility gap, exposing exactly where time is lost in transit without modifying our service’s business logic.
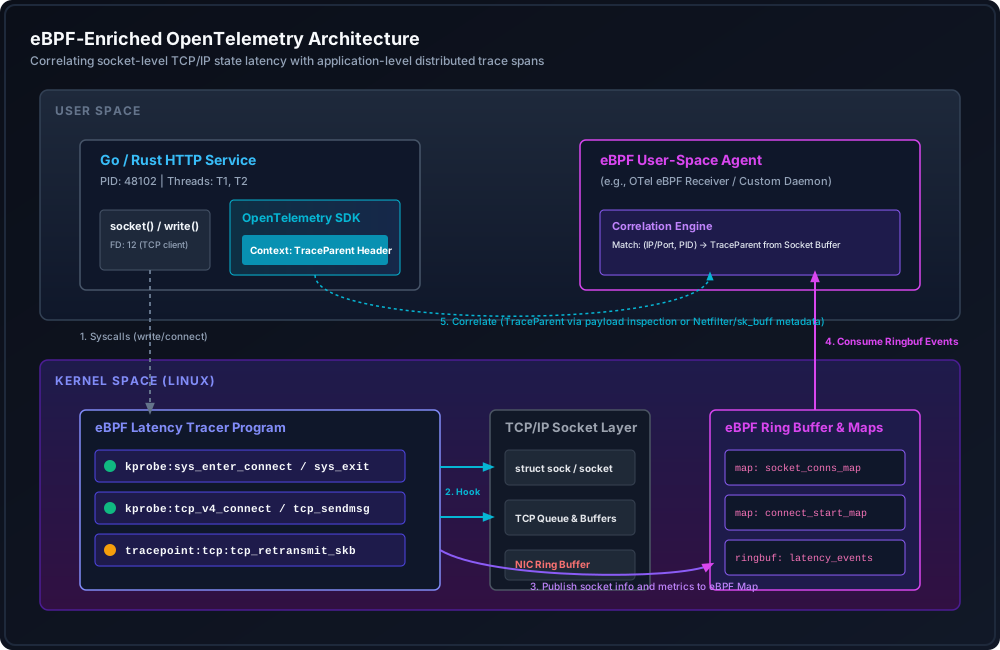
The Blind Spot of User-Space Tracing
Standard distributed tracing via the OpenTelemetry SDK operates entirely in user space. When your application initiates an outgoing HTTP call, database query, or gRPC request, the tracer starts a span, delegates the execution to the programming language’s standard networking library, and closes the span when the call returns.
From the SDK’s perspective, this operation is a monolithic black box. The tracer has no visibility into the state transitions of the underlying file descriptor, the TCP state machine, or the network device driver. The following critical phases are flattened into a single, generic latency metric:
- DNS Resolution Latency: The synchronous UDP socket roundtrip to resolve hostnames.
- TCP Handshake Duration: The three-way handshake (
SYN->SYN-ACK->ACK), which can be severely delayed if the target server’s TCP listen queue (somaxconn) is saturated. - TLS Negotiation Overhead: The cryptographic handshake, which requires multiple roundtrips and CPU processing.
- Kernel Transmission Queueing: Time spent in the socket write buffer (
sk_write_queue) or the network interface card’s (NIC) transmission ring buffer. - Network Retransmissions: Packet drops along the network path causing exponential backoffs in TCP window sizing.
- Kernel-to-User Space Transition: CPU scheduling latency where the network packet has arrived in the kernel, but the containerized user-space process is throttled and cannot read from the socket immediately.
When troubleshooting tail latency ($p99$ or $p99.9$), attributing a 500ms delay to “slow database execution” when the database is actually idling is a common and costly diagnostic error. We need a non-intrusive way to extract these kernel metrics and bind them to the correct application-level trace spans.
Hooking the Socket: eBPF in Action
eBPF allows us to execute sandboxed programs inside the Linux kernel in response to specific events (kprobes, tracepoints, and uprobes) without changing kernel source code or loading external modules. To measure socket latency, we need to trace the lifecycle of TCP connections at the kernel level.
The Linux kernel represents network sockets using the struct sock structure. When an application initiates a TCP connection, the kernel transitions the socket through various states. By placing kprobes on key socket functions, we can capture these transitions.
Specifically, we hook:
tcp_v4_connect/tcp_v6_connect: Triggered when an active TCP connection is initiated. We record the start timestamp.tcp_rcv_state_process: Triggered when a socket state changes (e.g., when the connection moves toTCP_ESTABLISHEDupon receiving theSYN-ACK). We calculate the elapsed time to get the TCP handshake latency.
The following kernel-space C code defines the eBPF program to capture handshake latency:
Beyond connection establishment, packet loss is the primary driver of latency spikes in cloud environments. By hooking the kernel’s TCP retransmission engine, we can record packet loss events directly on the socket, mapping them back to specific connection flows:
User-Space Consumption: Interacting with BPF Maps in Go
Once the eBPF programs are loaded into the kernel, we need a user-space daemon to consume the ring buffer events and cache them. This daemon acts as a bridge, exposing the low-level kernel metrics to the application’s runtime.
Using the github.com/cilium/ebpf library, we load the compiled bytecode, open the ring buffer, and decode the binary payload streamed from kernel space. We store these socket latency events in a high-performance in-memory cache, indexing them by their ephemeral source port.
The Correlation Challenge: Connecting Spans to Ephemeral Ports
How do we link a specific HTTP span to the TCP socket events processed by eBPF? In a high-throughput system running thousands of requests per second, we cannot rely on timestamps alone; too many connections overlap.
Instead, we must construct a deterministic correlation key. When an application initiates a connection, the operating system assigns a unique local IP and ephemeral source port (sport) to the socket. This four-tuple—(src_ip, src_port, dst_ip, dst_port)—uniquely identifies the connection.
In Go, we can intercept the socket creation lifecycle during an HTTP request using net/http/httptrace. This allows us to capture the exact local port assigned to the request’s connection and register it in the trace context.
Injecting eBPF Metrics into the OpenTelemetry SDK
Now that the local ephemeral port is mapped to the trace context during the network roundtrip, we can query our eBPF MetricsStore and inject the actual kernel latency values back into the OpenTelemetry span.
We implement this in the OpenTelemetry SDK using a custom SpanProcessor. When a span ends, the processor checks the span attributes for the local ephemeral port, retrieves the corresponding handshake and socket metrics from our cache, and appends them to the span.
Deploying in Production: OpenTelemetry Collector Integration
In a production Kubernetes environment, demanding that every application container runs with root privileges (CAP_SYS_ADMIN or CAP_BPF) to load eBPF programs is a security non-starter.
Instead, we extract the eBPF tracer from the application runtime and run it out-of-process as a Kubernetes DaemonSet. The OpenTelemetry Collector running on the node loads the eBPF programs, gathers the network metrics, and correlates the connection tuples with the traces passing through its pipeline.
The following configuration demonstrates how to set up the OpenTelemetry Collector’s eBPF network receiver alongside standard trace processors:
Production Failure Modes Unmasked by eBPF-OTel Correlation
By merging socket-level metrics into our distributed tracing spans, we can quickly diagnose complex network anomalies that previously required hours of packet capture (tcpdump) analysis.
Scenario 1: TCP SYN Queue Exhaustion
Under sudden spikes in traffic, a downstream service may look healthy in terms of CPU and memory, but upstream clients experience severe latency.
With eBPF span enrichment, we look at the span attributes for the slow requests. If ebpf.tcp.handshake_ms is spiking (e.g., to $1000\text{ms}$ or $3000\text{ms}$) while the downstream application’s span shows a processing time of only $2\text{ms}$, we know the delay is network-bound.
Specifically, this pattern points to TCP SYN backlog overflow. The target node’s kernel dropped the incoming SYN packet because the connection queue was full, forcing the client’s TCP stack to retransmit the SYN after the default backoff timeout ($1\text{ second}$ on Linux, doubling with each retry).
Scenario 2: Path MTU Discovery (PMTUD) Black Hole
A microservice works perfectly for API requests returning small payloads but times out when retrieving large database records.
When analyzing the traces for these timed-out requests, the span attributes show a massive spike in retransmissions (ebpf.tcp.retransmits > 5). By isolating the retransmission trace point, we verify that the MTU mismatch is causing network hops to drop packets exceeding their frame sizes silently, without sending back the required ICMP “Fragmentation Needed” packets.
Scenario 3: Container Network Interface (CNI) Queue Bloat
In high-density Kubernetes nodes, virtual network interfaces (veth pairs) act as software bridges between container namespaces and the host network.
Under heavy network congestion, packets can sit in the kernel’s network queuing discipline (qdisc) buffer. eBPF socket instrumentation shows that while actual transmission time over the wire (TCP RTT) is under $1\text{ms}$, the delay between when user space calls write() and when the first packet is actually transmitted by the network interface exceeds $50\text{ms}$. This tells platform engineers that the virtual interface queue limits (txqueuelen) need tuning.
Performance Implications and Overhead
A major advantage of using eBPF for system-level telemetry is its efficiency compared to traditional sidecar proxy architectures (e.g., Istio/Envoy).
Sidecars force every packet through two additional hops in user space (Application -> Envoy -> Kernel -> Envoy -> Application). This introduces:
- Context switching overhead between user and kernel space.
- Copying memory blocks multiple times between namespaces.
- Increased CPU consumption, often requiring $0.5$ to $1$ CPU core per sidecar under heavy loads.
In contrast, eBPF executes in-kernel. When an event fires, the eBPF program runs in a few microseconds, writes to a shared ring buffer, and exits.
The CPU overhead of running the kprobes defined in this post is negligible—typically less than $1.5\%$ of a single CPU core at $100,000$ packets per second. Memory utilization is bound by the size of the BPF maps, which we cap explicitly (e.g., $10,240$ active connection records), ensuring the daemon has a predictable and minimal resource footprint.
Conclusion & Production Checklist
Distributed tracing is only as good as the context it captures. If your spans end at the boundaries of user-space runtimes, you are missing half the story. Correlating eBPF socket-level telemetry with OpenTelemetry spans provides the deep network visibility needed to debug modern cloud-native systems.
To deploy this correlation pipeline in your own production cluster, follow this checklist:
- Verify Kernel Compatibility: Ensure your host operating system runs Linux Kernel 5.8 or higher, which supports
BPF_MAP_TYPE_RINGBUFand stable CO-RE features. - Expose Local Ports: Modify your client HTTP transports to track and attach local ephemeral ports to your tracing headers (e.g., exporting
net.peer.port.localon span tags). - Configure DaemonSets: Run the eBPF collector in a privileged namespace on Kubernetes, and use local IPC or gRPC sockets to expose the cached metrics to the OpenTelemetry SDK span processor.
- Tune BPF Map Sizes: Monitor map occupancy metrics to ensure maps are sized appropriately for your maximum concurrent connection count, avoiding drops when the maps are full.