ClickHouse MergeTree Internals: Sparse Indexes, Part Merges, and Query Execution
A deep dive into how ClickHouse MergeTree stores data, builds sparse indexes, merges parts, and executes analytical queries at billion-row scale.
You have a query scanning 500 million rows. In Postgres it’s a timeout. In BigQuery it’s a $4 bill waiting to happen. In ClickHouse — on a single 32-core node with NVMe — it finishes in 800ms and reads 2.1 GB off disk instead of 180 GB. That gap isn’t magic; it’s the result of a storage engine purpose-built for analytical workloads. Understanding how MergeTree actually works — not just “it’s columnar and fast” — is the difference between using ClickHouse well and fighting it for months while your query plans stay broken.
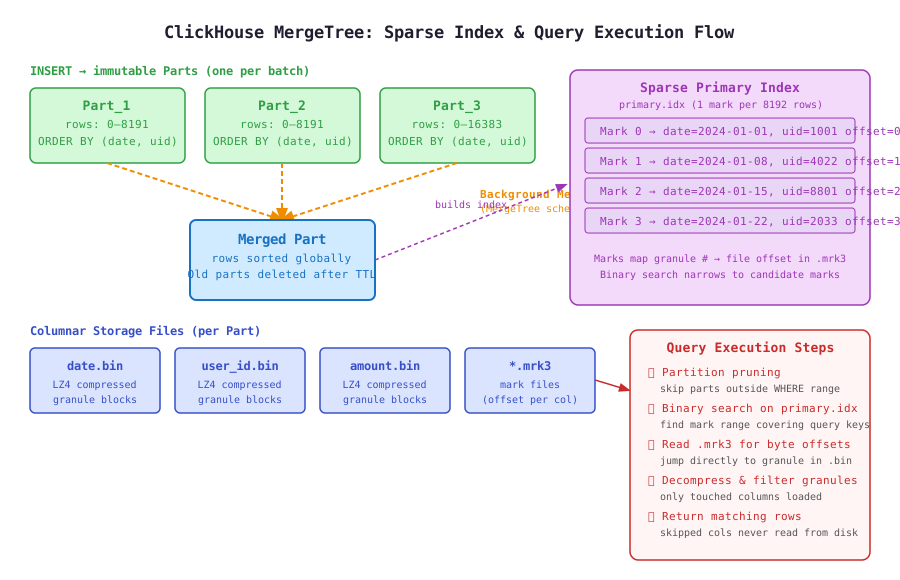
How MergeTree Stores Data
Every INSERT in ClickHouse creates an immutable part on disk. A part is a directory containing one .bin compressed column file and one .mrk3 mark file per column, plus the primary index (primary.idx), partition metadata, and a checksum file. Parts are never modified in place.
-- snippet-1
CREATE TABLE events
(
    date        Date,
    user_id     UInt64,
    event_type  LowCardinality(String),
    amount      Float64,
    metadata    String
)
ENGINE = MergeTree
PARTITION BY toYYYYMM(date)
ORDER BY (date, user_id)
SETTINGS index_granularity = 8192;
ORDER BY is the primary sort key and doubles as the primary index key. Every 8192 rows (one granule) ClickHouse writes one mark into primary.idx containing the minimum key value for that granule plus a file offset. With 100 million rows you get ~12,200 index marks — the entire index fits in a few MB of RAM. That’s the sparse index: instead of indexing every row, you index one sentinel per granule and skip everything in between.
The .mrk3 files are position maps. For each granule they record the compressed block offset and the uncompressed offset within the block for every column file. This is what lets ClickHouse jump directly to byte position N in amount.bin without reading the surrounding data.
Part Merges: Why They Happen and What Goes Wrong
Because every INSERT creates a new part, a table with continuous writes accumulates thousands of parts quickly. Too many parts means every query must open thousands of files and merge their results — “too many parts” is a real ClickHouse failure mode that degrades query latency by 10-50x and triggers the DB::Exception: Too many parts error once you breach the 300-part limit per partition by default.
The MergeTree background merge scheduler runs continuously. It selects candidate parts by size and recency, merges them into a single larger part, then deletes the originals after a configured TTL. During a merge:
- Rows from all source parts are read and merged in sort-key order (external merge sort).
- Duplicates are deduplicated if you’re using
ReplacingMergeTreeorCollapsingMergeTree. - The new part is written atomically — queries continue reading old parts until the swap completes.
system.mergestracks in-progress merges; stalled merges showis_currently_executing = 1with elapsed time climbing.
-- snippet-2
-- Monitor merge health in production
SELECT
    table,
    partition,
    elapsed,
    progress,
    num_parts,
    result_part_name,
    rows_read,
    rows_written,
    memory_usage
FROM system.merges
WHERE database = 'analytics'
ORDER BY elapsed DESC;

-- Count parts per partition — alert if > 50
SELECT
    partition,
    count() AS part_count,
    sum(rows) AS total_rows,
    formatReadableSize(sum(bytes_on_disk)) AS disk_size
FROM system.parts
WHERE table = 'events' AND active = 1
GROUP BY partition
ORDER BY part_count DESC;
The merge throughput bottleneck is almost always I/O. On a cluster with 10 GB/s NVMe throughput, a merge touching 200 GB runs for 20+ seconds. If your INSERT rate creates parts faster than merges can consolidate them, you enter a death spiral. The lever is max_bytes_to_merge_at_max_space_in_pool (default 150 GB) and background_pool_size (default 16 threads). Increasing both on write-heavy nodes is standard practice.
Sparse Indexes: The Binary Search That Skips 99% of Disk I/O
When a query arrives with WHERE date = '2024-01-15' AND user_id = 8801, ClickHouse does not scan primary.idx linearly. It runs a binary search to find the leftmost mark where the key could match, then extends right to find the rightmost mark. The result is a closed interval of mark indices — say marks 42 through 67. Only those 25 granules (25 × 8192 = ~205,000 rows) get read from disk. Everything else is skipped.
This works well when your query filter prefix-matches the ORDER BY. It breaks down badly when it doesn’t. If you ORDER BY (date, user_id) but filter only by user_id, ClickHouse cannot use the sparse index — user_id is not monotone without date being fixed. You read the whole partition.
-- snippet-3
-- Check how many granules a query actually reads
-- Run EXPLAIN before the real query
EXPLAIN indexes = 1
SELECT
    user_id,
    sum(amount) AS total
FROM events
WHERE date >= '2024-01-01' AND date < '2024-02-01'
  AND user_id IN (1001, 4022, 8801)
GROUP BY user_id;

-- Look for: Granules: X/Y — X read out of Y total
-- A ratio > 20% on a large table warrants index review
The EXPLAIN output shows Selected marks: 3 / 12210 for a well-indexed query. That’s the metric that matters — not rows or bytes alone, but how many granules the engine had to open. Each opened granule means decompressing a block, which is CPU. Each skipped granule costs nothing.
Secondary Indexes (Skipping Indexes) Are Not What You Think
ClickHouse supports secondary indexes called data skipping indexes. The name is precise: they help skip granules, they are not traditional B-tree secondary indexes. They don’t point to individual rows.
-- snippet-4
-- Bloom filter skipping index for high-cardinality string filtering
ALTER TABLE events
    ADD INDEX idx_metadata metadata TYPE tokenbf_v1(32768, 3, 0) GRANULARITY 4;

-- minmax skipping index for numeric range queries
ALTER TABLE events
    ADD INDEX idx_amount amount TYPE minmax GRANULARITY 8;

-- After adding, materialize it for existing data
ALTER TABLE events MATERIALIZE INDEX idx_metadata;
GRANULARITY 4 means the index covers 4 granules at once — it stores one index entry per 4 × 8192 = 32,768 rows. A bloom filter index on metadata checks: “does any token in this 32K-row block match?” If not, skip the block entirely. False positives exist (bloom filters always lie sometimes), but false negatives cannot happen — if the filter says skip, it’s safe.
Where skipping indexes fail: low-cardinality columns where most granules contain the value you’re filtering for. An index on event_type with 5 distinct values won’t skip much if each type appears in every part. Always check the ProfileEvents output for SelectedMarks vs TotalMark after adding a skipping index to verify it’s actually helping.
Query Execution: The Granule Pipeline
A ClickHouse query against MergeTree runs this sequence:
- Partition pruning: Parts whose partition key range doesn’t overlap the WHERE clause are eliminated without opening any files.
- Primary index binary search: Within surviving parts, binary search
primary.idxin memory to find the mark range covering the query key range. - Skipping index evaluation: For remaining marks, evaluate any applicable skipping indexes to eliminate more granules.
- Mark file reads: For each surviving granule, read
.mrk3to get the byte offset in each required.binfile. - Columnar decompression: Decompress only the columns referenced in SELECT, WHERE, GROUP BY, ORDER BY. Columns not touched are never read.
- Row filtering: Apply the full WHERE predicate on the decompressed granule data. Some rows within a granule won’t match — that’s expected.
- Aggregation and result: GROUP BY executes on the filtered rows, results merged across threads and parts.
-- snippet-5
-- Inspect what actually happened at runtime
SELECT
    query_id,
    query,
    read_rows,
    read_bytes,
    result_rows,
    ProfileEvents['SelectedParts']       AS parts_read,
    ProfileEvents['SelectedMarks']       AS marks_read,
    ProfileEvents['TotalMarksOfMergeTree'] AS marks_total,
    ProfileEvents['RealTimeMicroseconds'] / 1e6 AS wall_seconds
FROM system.query_log
WHERE type = 'QueryFinish'
  AND table LIKE '%events%'
  AND event_date = today()
ORDER BY event_time DESC
LIMIT 20;
The ratio SelectedMarks / TotalMarksOfMergeTree is your index efficiency score. For a well-designed schema filtering on the ORDER BY prefix, you want this below 5%. If you’re at 80%, either the sort key is wrong for your query pattern or you’re missing partition pruning.
The ORDER BY Key Is an Architectural Decision
Choosing the wrong ORDER BY key is the most expensive mistake you can make in a ClickHouse schema. It’s hard to change post-hoc because you’d need to recreate the table and reload all data. The rules:
- Put the highest-cardinality columns last in the key. A filter on
(date, user_id)where date has 365 values and user_id has 10M is better served byORDER BY (date, user_id)— date narrows the search space before user_id further refines it. - The leftmost columns in ORDER BY are the primary index key. Adding more columns adds specificity but also increases index mark size and merge cost.
- Partition granularity matters.
PARTITION BY toYYYYMM(date)withORDER BY (date, user_id)means partition pruning eliminates whole months before the sparse index runs.PARTITION BY toYYYYMMDD(date)is too fine — you get 365+ partitions per year, each with its own set of parts and merge pressure.
-- snippet-6
-- Example: multi-tenant analytics table design
-- Queries always filter by tenant_id + date range
CREATE TABLE tenant_events
(
    tenant_id   UInt32,
    date        Date,
    user_id     UInt64,
    event_type  LowCardinality(String),
    properties  Map(String, String),
    value       Float64
)
ENGINE = MergeTree
PARTITION BY (tenant_id, toYYYYMM(date))
ORDER BY (tenant_id, date, user_id)
SETTINGS index_granularity = 8192,
         merge_with_ttl_timeout = 3600;

-- Per-tenant TTL: drop data older than 90 days
ALTER TABLE tenant_events
    MODIFY TTL date + INTERVAL 90 DAY;
Partitioning by (tenant_id, toYYYYMM(date)) means a query for tenant_id = 42 and last 30 days touches at most 2 partition directories. Without tenant_id in the partition key, the query hits all tenant data in those months and relies entirely on the sparse index — which still works but opens far more parts.
Watching MergeTree in Production
The queries you should have dashboarded:
-- snippet-7
-- Part accumulation: partitions trending toward 300-part limit
SELECT
    database,
    table,
    partition,
    count() AS active_parts,
    sum(rows) AS rows,
    formatReadableSize(sum(bytes_on_disk)) AS on_disk,
    max(modification_time) AS last_modified
FROM system.parts
WHERE active = 1
GROUP BY database, table, partition
HAVING active_parts > 30
ORDER BY active_parts DESC;

-- Background merge lag
SELECT
    database,
    table,
    count() AS running_merges,
    max(elapsed) AS max_elapsed_sec,
    sum(rows_read) AS rows_merged_so_far
FROM system.merges
GROUP BY database, table
ORDER BY max_elapsed_sec DESC;

-- Replication lag (for ReplicatedMergeTree)
SELECT
    database,
    table,
    is_leader,
    queue_size,
    inserts_in_queue,
    merges_in_queue,
    log_max_index - log_pointer AS log_lag
FROM system.replicas
WHERE queue_size > 0
ORDER BY log_lag DESC;
Real incidents to watch for: parts spiking after a deployment that bumped INSERT batch size from 10K to 100 rows (10x more parts per second), a stalled merge blocking partition cleanup and triggering the 300-part exception, or a skipping index with 0% skip rate consuming merge CPU for no gain.
What MergeTree Cannot Do
MergeTree is not a general-purpose database engine. Understanding the limitations prevents architectural mistakes:
No in-place updates. ALTER TABLE events UPDATE amount = amount * 1.1 WHERE date = '2024-01-15' works but triggers a full part rewrite — it’s a batch operation, not a row mutation. In ReplacingMergeTree you insert a new row with the same key and a higher version, and the engine deduplicates during merge. Reads may see both old and new rows until the merge completes.
No unique key enforcement. ReplacingMergeTree eventually deduplicates but makes no synchronous uniqueness guarantee. If you SELECT before the merge runs, you get duplicates. Use FINAL keyword to force deduplication at query time — at the cost of disabling parallel reads and degrading performance significantly on large tables.
Granule size is a global setting. index_granularity = 8192 applies to the whole table. Too-small granules mean more marks, more overhead. Too-large granules mean coarser skipping and more data read per cache miss. For tables with very wide rows (many columns, large strings), decreasing to 4096 sometimes helps. For narrow append-only event tables, 8192 is rarely wrong.
The engineers who get the most out of ClickHouse are the ones who accept these constraints upfront and design their schema, partitioning, and sort key before writing a single row. Retrofitting an ORDER BY is a multi-terabyte data migration. Getting it right the first time isn’t premature optimization — it’s the job.