Building a Real-Time Tail-Based Sampling Engine for OpenTelemetry Collectors at 100k RPS
Learn how to architect a highly performant, two-tier tail-based sampling engine in OpenTelemetry to process 100k RPS without running out of memory.
At a scale of 100,000 requests per second (RPS), tracing telemetry becomes both your most valuable operational asset and your most expensive infrastructure line item. Relying on head-based sampling—where trace collection decisions are made blindly at the API gateway before request execution even begins—forces you to trade visibility for cost, dropping the critical 500 errors, database locking exceptions, and anomalous 99th-percentile latency spikes that occur deep within microservice call trees. Tail-based sampling resolves this by holding trace spans in memory until the entire execution path completes, enabling a rule engine to sample 100% of errors and slow requests while discarding redundant success paths. However, buffering trace telemetry for hundreds of thousands of concurrent requests creates immense state density, risking catastrophic Out-Of-Memory (OOM) failures and severe Go runtime garbage collection thrashing. To operate tail-based sampling safely at this magnitude, you must deploy a highly optimized, two-tier routing and evaluation architecture.
The Cost Trap of Tracing at High Scale
At 100k RPS, the math behind trace collection is punishing. If an average transaction spans 8 microservices, with each service generating 1.5 spans on average (HTTP calls, DB queries, cache lookups), your system generates 12 spans per trace. At 100k RPS, that is 1.2 million spans per second. With an average span payload of 1.2 KB (including span attributes, resource metadata, log events, and stack traces), the raw telemetry data rate reaches:
\[1,200,000 \text{ spans/sec} \times 1.2 \text{ KB} = 1.44 \text{ GB/s} \text{ (or } 11.52 \text{ Gbps)}\]Ingesting and storing 1.44 GB/s of data translates to roughly 124 Terabytes of raw tracing data per day. Writing this volume of data directly to a storage backend like Grafana Tempo or ClickHouse is financially prohibitive and puts a massive load on write-ahead logs and indexers.
Under head-based sampling, you might apply a flat 1% sampling rate at the API gateway, reducing ingestion to 12.4 TB/day. However, this is a dangerous gamble. If a critical payment database timeout occurs on only 0.05% of requests, a uniform 1% head-based sample has a high mathematical probability of discarding the entire failure context. You end up paying for a system that tells you everything about your healthy traffic but nothing about your tail failures.
Tail-based sampling shifts the decision-making process to the end of the request execution lifecycle. By buffering spans in memory, you can inspect the final status of the trace. If a trace contains a span with otel.status_code = "ERROR" or if its total duration exceeds 500ms, you retain the complete trace. If it is a standard 200 OK transaction, you drop it or sample it at a minimal rate (e.g., 0.1%).
The challenge is state. To evaluate trace completion, spans must be grouped by their common trace_id. If spans are routed randomly to a cluster of collectors, no single collector will have the complete span collection to make an informed decision. This results in fragmented traces where parts are sampled and parts are dropped.
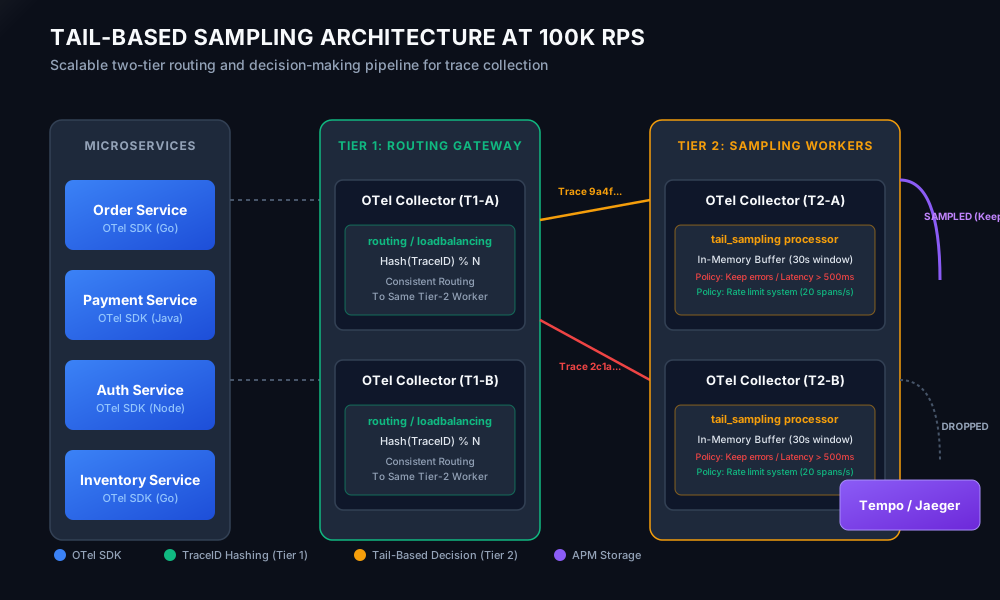
To solve this, we must build a two-tier collector architecture:
- Tier 1 (Routing Gateway): A stateless layer of collectors that receives spans from application SDKs, extracts the trace ID, hashes it, and consistently routes all spans for that trace ID to the same Tier 2 worker node.
- Tier 2 (Sampling Workers): A stateful layer of collectors that buffers the incoming spans in memory, evaluates sampling rules once the trace settles, and forwards sampled data to the storage engine.
Tier 1: Gateway Routing via Consistent Hash Exporters
The primary role of the Tier 1 gateway is to perform consistent hashing on the trace ID and direct the payload to Tier 2. This layer must remain completely stateless so it can scale horizontally using standard Kubernetes Horizontal Pod Autoscalers (HPAs) based on CPU utilization.
We use the OpenTelemetry Collector’s loadbalancing exporter. This exporter intercepts spans, extracts the trace_id, hashes it using a FNV-1a consistent hashing algorithm, and maintains a pool of backend connections.
Below is the production-grade YAML configuration for the Tier 1 Gateway Collector:
Critical Operational Details for Tier 1:
routing_key: "trace": This directive forces the exporter to compute the target backend using the trace ID instead of the default round-robin approach.- DNS Resolver: Using a Kubernetes headless service (
otel-tier2-headless) allows the gateway to dynamically resolve the IP addresses of individual Tier 2 pods. The gateway queries DNS every 10 seconds to discover changes in the Tier 2 pool. - Batching Strategy: Notice that the
batchprocessor is placed before theloadbalancingexporter. Theloadbalancingexporter internally unpacks the batches and groups spans by trace ID before sending them to the respective Tier 2 nodes. Keepsend_batch_sizelarge to maximize network efficiency between SDKs and the Gateway.
A critical failure mode in this setup is the rebalancing storm. When a Tier 2 pod scaling event occurs (e.g., scale out from 10 to 12 pods), the consistent hash ring changes. Roughly 16.7% of trace IDs will map to new nodes. During this rebalance window, spans belonging to active traces will be split across old and new Tier 2 collectors, resulting in partial traces. To minimize this window, keep Tier 2 scaling actions conservative and use longer cooldown periods on your HPAs.
Tier 2: The Stateful Sampling Worker
The Tier 2 collectors receive routed spans, group them in memory, and run evaluation policies. This layer is highly stateful and memory-intensive.
To compute the memory requirements for each Tier 2 node:
- Total Ingestion Rate: 1.2 million spans/sec.
- Cluster Size: 10 replicas.
- Throughput per Node: 120,000 spans/sec (~10,000 traces/sec).
decision_waitWindow: 10 seconds.- Raw Trace State in Memory: 120,000 spans/sec * 10 seconds = 1.2 million spans.
- Raw Memory Size: 1.2M spans * 1.2 KB = 1.44 GB of raw JSON/Protobuf telemetry data per node.
In practice, Go’s pointer structures, map hash-buckets, and garbage collection overhead multiply this number by 4x to 6x. A single Tier 2 node will require at least 8 GB to 10 GB of memory to run safely under standard load, with a buffer for traffic spikes.
Here is the configuration for a stateful Tier 2 Collector:
Key Parameters:
decision_wait: 10s: This defines how long the collector waits after receiving the first span of a trace before making its sampling decision. If network latency between your services is low, this can be safely reduced to 5s, saving 50% of your memory footprint.num_traces: 150000: The max limit of active traces stored in the cache. If this limit is hit, older traces are evicted prematurely, and their decision is made immediately, which can lead to dropped spans if late-arriving segments show up later.expected_new_traces_per_sec: 15000: Configures the initial capacity of Go’s internal hash maps. This prevents runtime re-allocation of large hash tables, reducing CPU overhead during high traffic.
Writing a Custom Tail-Sampling Evaluator in Go
Standard OpenTelemetry configurations use declarative policies. However, at 100k RPS, you will encounter edge cases that require procedural logic. For example, you may want to apply adaptive sampling: if a specific downstream database starts failing, the collector might suddenly attempt to sample 100% of the traces (due to the error policy), which would overwhelm the storage backend. You need an evaluator that dynamically scales down its sample rate for high-frequency errors while retaining 100% of low-frequency anomalies.
To do this, you can write a custom evaluator inside the OpenTelemetry Collector build using Go. The code block below implements a memory-efficient trace buffer and evaluation policy:
By embedding this evaluator, you move trace logic out of static yaml patterns and into your own code, allowing you to interface with Redis, read dynamic config maps, or integrate database stats directly into your tail-sampling pipeline.
Reclaiming Memory and Combating the Go GC Tax
At 100k RPS, the memory overhead of the Go runtime becomes a major bottleneck. A runtime receiving millions of tiny allocation requests for spans, maps, slices, and trace wrappers will exhaust memory quickly. The Go Garbage Collector (GC) will enter write-barrier and sweep phases, consuming CPU cycles and triggering Stop-The-World (STW) pauses.
To prevent this, you must reuse objects. The collector’s internal memory pools can be configured to use Go’s sync.Pool. This allows you to recycle allocated slices and structs instead of releasing them to the runtime allocator.
Here is a performance-focused implementation of a pool-backed trace buffer:
This pool-backed model changes the memory allocation curve under load. Instead of memory usage rising linearly with traffic, memory consumption plateaus once the pools reach steady-state.
Handling Real-World Production Failure Modes
Operating stateful OTel systems at high load exposes complex failure modes that must be handled gracefully:
1. The “Late Span” Problem
If a microservice goes offline or experiences severe network congestion, its local OTel SDK buffer will queue spans. When the service recovers, it flushes these spans to the gateway. If this flush occurs 30 seconds after the transaction executed, the Tier 2 collector will have already completed the evaluation, decided to drop the trace, and evicted the memory buffer. When the late spans arrive at Tier 2, they look like a brand new trace. However, because they only represent a fragment of the transaction (missing the root span and downstream calls), the collector cannot evaluate them properly. To fix this, we implement a routing rule at Tier 2 that identifies late-arriving fragments (spans that arrive without a corresponding parent span in the current buffer) and either routes them to a secondary “catch-all” queue or drops them early.
2. Cascading Out-of-Memory (OOM) Cascades
If the storage backend (Tempo, Jaeger) slows down or suffers an outage, the export queue in the Tier 2 collectors will fill up. Since the collectors cannot export, the tail_sampling processor cannot evict traces from memory.
Without safeguards, memory usage will spike until the Linux Kernel OOM killer terminates the collector process. This triggers a cascading failure: the remaining Tier 2 instances must take on the extra load, quickly running out of memory and crashing in sequence.
To prevent this, you must place a strict limit on memory usage using the memory_limiter processor, configure a fallback destination, and use disk-backed queuing for outgoing payloads.
Performance Tuning and Production Validation
To run this architecture at 100k RPS in Kubernetes, you must configure Go’s runtime settings and monitor collector performance using Prometheus metrics.
Key Prometheus Alerting Rules
You must track heap memory, decision latency, and buffer withdrawals. If decision latency rises, your collector is bottlenecked on processing logic or garbage collection, which will cause memory usage to grow.
Go Runtime Configuration in Kubernetes
By default, the Go runtime is unaware of Kubernetes container memory limits, leading to poorly timed GC sweeps that can trigger OOM errors. You must set GOMAXPROCS, GOGC, and GOMEMLIMIT environment variables in your deployment manifest.
Summary of Go Runtime Settings:
GOMEMLIMIT: Setting this to 14 GiB (out of a 16 GiB container limit) prevents the container from being terminated by the OOM killer. Go will trigger garbage collection sweep phases aggressively as memory usage approaches 14 GiB to keep the heap footprint small.GOGC=200: Under normal operation, this value tells Go to prioritize throughput and defer GC cycles until the heap size grows, saving CPU resources. When memory usage climbs nearGOMEMLIMIT, Go will override this setting to prioritize reclaiming memory.GOMAXPROCS: Configures the runtime to match the container’s CPU allocation limits. This prevents CPU throttling caused by thread context switching.
By splitting trace processing into a stateless consistent-hashing gateway layer and a stateful sampling worker pool, you can run tail-based sampling reliably at 100k RPS. This architecture ensures you capture critical error contexts and latency anomalies while keeping infrastructure costs predictable.