Building a Custom Prometheus Exporter for eBPF-based Disk I/O Latency Tracking in Go
Build a production-grade Prometheus exporter using Go and eBPF raw tracepoints to capture microsecond-accurate disk I/O tail latency with negligible CPU overhead.
When running high-throughput databases like PostgreSQL or log-structured merge-tree (LSM) engines like RocksDB in production, disk I/O stalls are a silent killer. Traditional monitoring tools like iostat or the Prometheus Node Exporter scrape block device stats from /proc/diskstats, yielding averages over 10-second or 15-second intervals. These averages conceal micro-bursts of latency—such as a single write blocking on a journal commit for 250 milliseconds while 9,999 other writes finish in under 1 millisecond. An average latency of 1.02 milliseconds looks perfectly healthy on your Grafana dashboard, but the application experiences severe tail latency spikes that throttle query throughput and trigger database connection pool exhaustion. To capture the true distribution of storage performance, we must intercept I/O requests directly inside the Linux kernel as they traverse the block layer. By leveraging eBPF (Extended Berkeley Packet Filter) and Go, we can hook request dispatch and completion events, count them in logarithmic buckets, and expose high-fidelity latency histograms to Prometheus with negligible CPU overhead.
The Blind Spots of Standard Disk Observability
Most engineers rely on /proc/diskstats for storage observability. The fields exported by the kernel include sectors read/written, time spent reading/writing, and the number of I/O operations currently in progress. While valuable, these statistics suffer from two major limitations: the averaging effect and queue time inflation.
First, averaging metrics over a scrape interval is mathematically guaranteed to hide outliers. If your disk experiences a momentary queue saturation where a few block writes take 500ms due to SSD garbage collection, but the disk resolves them and processes another 50,000 requests at 100 microseconds, the resulting arithmetic mean is mathematically flat. You cannot calculate percentiles (such as P99 or P99.9) from averaged counters.
Second, block layer metrics like node_disk_io_time_seconds_total measure the time a block device has non-zero requests in flight, but they do not distinguish between queue queuing delay (time spent waiting in software I/O schedulers like mq-deadline or kyber) and actual device service time (the physical time the NVMe controller or SSD flash took to execute the command). To troubleshoot storage bottlenecks, database administrators need to know whether the latency is originating from queue contention at the OS level or physical hardware bottlenecks.
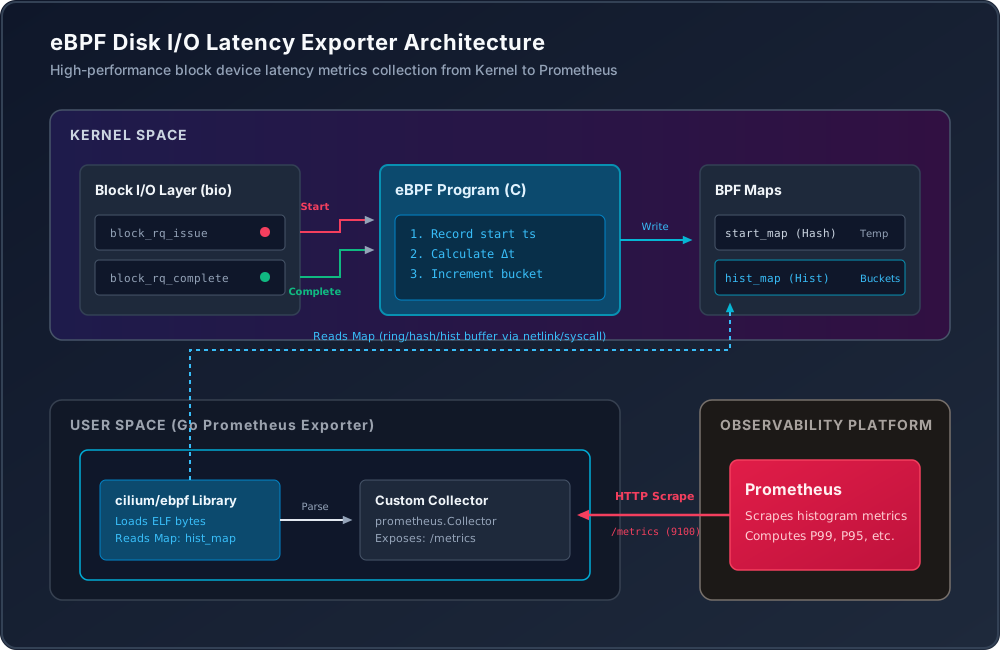
We can solve this by tracing the exact duration of each struct request in the block I/O layer. Using eBPF, we can record a high-resolution timestamp when a request is dispatched to the device driver and another when the driver signals completion via a hardware interrupt.
Understanding the Linux Block I/O Layer
To trace disk latency, we need to locate the boundaries of block device transactions. In the Linux kernel, I/O requests are represented by struct request. When a file system or user-space application writes data, it allocates a block input/output structure (struct bio). The block layer merges adjacent bio structures and packs them into a struct request queue.
The two critical lifecycle events for a request are:
- Issue: The request is dispatched from the I/O scheduler queue to the device driver’s hardware queue. This corresponds to the kernel tracepoint
block:block_rq_issue. - Complete: The device completes the transaction, and the driver triggers an interrupt, freeing the request. This corresponds to the kernel tracepoint
block:block_rq_complete.
While traditional eBPF tools use kprobes (kernel probes) on functions like blk_account_io_start and blk_account_io_done, kprobes are unstable. If the kernel’s internal function signatures change in a minor kernel update, the eBPF program will fail to load.
A cleaner, more stable alternative is using raw tracepoints (raw_tracepoint/block_rq_issue and raw_tracepoint/block_rq_complete). Unlike standard tracepoints, which format variables into read-friendly strings inside kernel buffers, raw tracepoints expose the direct kernel argument pointers (struct request *) with minimal overhead. Because raw tracepoints are part of the kernel’s stable trace infrastructure, they are less prone to breaking across kernel releases.
Designing the eBPF Program in C
Our eBPF program must accomplish three goals:
- Capture the issue timestamp for each
struct requestand store it. - Intercept the completion event, calculate the elapsed time in nanoseconds, and delete the issue record.
- Compute the logarithmic index of the elapsed time and increment the count in a bucket map.
We define two maps. The first is start_map, a hash map keyed by the memory address of the struct request (cast to u64). The value is the start timestamp in nanoseconds. The second map, latency_seconds_bucket, is a hash map that stores our histogram counts. To support multi-device systems, we define a composite key consisting of the device’s major/minor number and the logarithmic bucket index.
We must also capture the exact sum of all latencies to calculate the average latency accurately. To avoid creating another map, we store the cumulative sum in the same latency_seconds_bucket map using a reserved bucket index (0xffffffff).
Next, we implement the tracepoint handlers. When a request is issued, we record the start time. When it completes, we fetch the start time, compute the delta, and update the histogram.
We use BPF CO-RE (Compile Once – Run Everywhere) helpers like BPF_CORE_READ to safely read fields inside the nested structures of struct request across different kernel versions.
Compiling and Generating Go Bindings with bpf2go
To load our compiled C bytecode into the kernel, we use the cilium/ebpf package. It includes a tool called bpf2go that compiles the C program using Clang/LLVM and encapsulates the resulting ELF binary into Go files. This creates type-safe Go structs representing our maps and programs, removing the need for manual ELF parsing.
To generate the bindings, create an empty main.go and run the go generate directive.
Building the Custom Prometheus Collector in Go
Prometheus allows you to implement a custom collector by implementing the prometheus.Collector interface. Instead of modifying global Go state inside handler loops, a custom collector queries the underlying data source (our eBPF map) on-demand when Prometheus performs a scrape. This ensures that the metrics are always up-to-date and avoids map-access race conditions.
The core of our collector resides in the Collect function. We must:
- Iterate over the
latency_seconds_bucketeBPF map. - Group the data by device major/minor code.
- Separate the exact latency sum (
0xffffffff) from the logarithmic count buckets. - Construct cumulative histogram buckets matching Prometheus’s format, sorted from smallest to largest upper bounds.
Finally, we write the exporter’s boilerplate code in main.go. We hook our loading sequence to system signals to guarantee clean resource cleanup during updates, register the custom collector, and mount a standard HTTP router to expose /metrics on port 9100.
Handling Production Realities and Performance Tuning
Running eBPF code on production database servers requires extreme caution. When traffic hits 100,000 queries per second, disk transactions can scale to tens of thousands of I/O operations per second (IOPS). At this level, tracking disk latencies can introduce issues if your code isn’t optimized.
1. The Request Leakage Problem (Orphaned Keys)
When a storage controller driver issues requests, they don’t always follow a clean issue-to-complete workflow. Some I/O operations are cancelled, some fail immediately, and others are merged by the I/O scheduler. When a request is merged (e.g., via block_rq_remerge), the target struct request pointer might never trigger a corresponding block_rq_complete event.
If this happens, the start timestamp will leak in the start_map hash map. Over days of production runs, these leaked entries will consume memory until the map hits its maximum limit of 65536 entries, at which point new requests can no longer be tracked.
To mitigate this in production, you have two options:
- Add hooks for request merges: Attach eBPF programs to tracepoints like
block_rq_remergeto clean up the merged request pointer fromstart_map. - Implement a cleaning mechanism in Go: Periodically read
start_mapfrom the Go collector, identify keys with timestamps older than 60 seconds (representing hung/merged I/O), and delete them via map calls.
2. Lock Contention and CPU Cache Hits
In high-performance storage configurations (e.g., RAID 0 array of NVMe disks), requests are dispatched concurrently across multiple CPU cores. A shared hash map like start_map requires internal bucket locking when eBPF probes execute bpf_map_update_elem and bpf_map_delete_elem. This can lead to CPU cache thrashing.
To reduce latency overhead, you could use a per-CPU hash map (BPF_MAP_TYPE_PERCPU_HASH). However, there is a catch: an I/O request issued on CPU 0 might trigger its completion interrupt on CPU 3. If you use a per-CPU map, the completion handler on CPU 3 will fail to locate the start timestamp stored in CPU 0’s map.
Therefore, you must keep the request-timestamp tracking map (start_map) as a shared, global hash map. However, you can optimize the bucket aggregation map (latency_seconds_bucket) by using a BPF_MAP_TYPE_PERCPU_HASH map. This allows each CPU core to increment bucket counts in its own local memory segment without locking, which you then sum together when Prometheus scrapes the metrics in Go.
3. Deploying Safely
Because loading eBPF programs requires administrative privileges, the exporter must run with elevated permissions. Running the process as root is a major security risk. Instead, run the exporter as a dedicated system user and grant only the required capabilities (CAP_BPF and CAP_SYS_ADMIN) using a systemd service file.
Conclusion
By implementing this custom exporter, you gain full visibility into tail latency. Traditional average metrics can mask performance issues, but logarithmic eBPF histograms capture the actual performance of your storage layer. This architecture allows you to capture raw hardware service times and queue latency with minimal CPU overhead, making it ideal for high-throughput production environments.