Automated Incident Remediation: Self-Healing Kubernetes CrashLoops with Event-Driven Runbooks
Build an event-driven self-healing pipeline using Prometheus, Alertmanager, and Go/Python to automatically diagnose and recover Kubernetes CrashLoopBackOffs.
At 3:00 AM on a high-traffic retail day, a critical payment gateway service begins crash-looping. The root cause is a stale DNS entry cached by the container runtimes following a database failover, coupled with an unhandled network connection timeout in the application code. While PagerDuty wakes up the on-call engineer, the service fails to recover on its own, dropping thousands of transaction requests and racking up SLA violation penalties. Mean Time to Resolution (MTTR) under manual intervention is rarely less than 15 minutes, dominated by human notification latency, VPN login delays, and manual command execution. Automated incident remediation transforms this process: instead of waiting for a human operator, an event-driven system catches the CrashLoopBackOff state, executes precise diagnostic routines, runs safe mitigative actions, and restores service availability in under 30 seconds.
The Cost of Human-in-the-Loop Operations
In production environments, the traditional model of paging an engineer for every service failure is unsustainable. The lifecycle of a manual incident response typically looks like this:
- Detection (0-3 minutes): Prometheus scrapes metric targets and Alertmanager evaluates alerting rules.
- Notification (3-5 minutes): Alertmanager routes the firing alert to PagerDuty, which triggers a phone call or push notification to the on-call engineer.
- Context Switching (5-10 minutes): The engineer wakes up, finds their laptop, connects to the corporate VPN, and opens the monitoring dashboards.
- Triage & Diagnosis (10-15 minutes): The engineer runs
kubectl logs, checkskubectl describe pod, queries Grafana, and isolates the issue. - Mitigation (15-20 minutes): The engineer executes a manual remediation step, such as scaling the deployment, restarting the pod, or purging a corrupted cache key.
During these 20 minutes, a microservice processing 5,000 requests per second will drop 6,000,000 transactions. If the transaction value averages $10, the business loses millions of dollars in revenue, not to mention customer trust and reputation.
Automated self-healing shifts the mitigation phase from a post-page human activity to a pre-page software execution. It is crucial to understand that self-healing is not a replacement for root-cause analysis or fixing underlying software bugs. Instead, it acts as a tactical control loop—a digital first-responder that stabilizes the system to buy the engineering team time to implement permanent fixes during regular working hours.
Architecture of an Event-Driven Remediation Pipeline
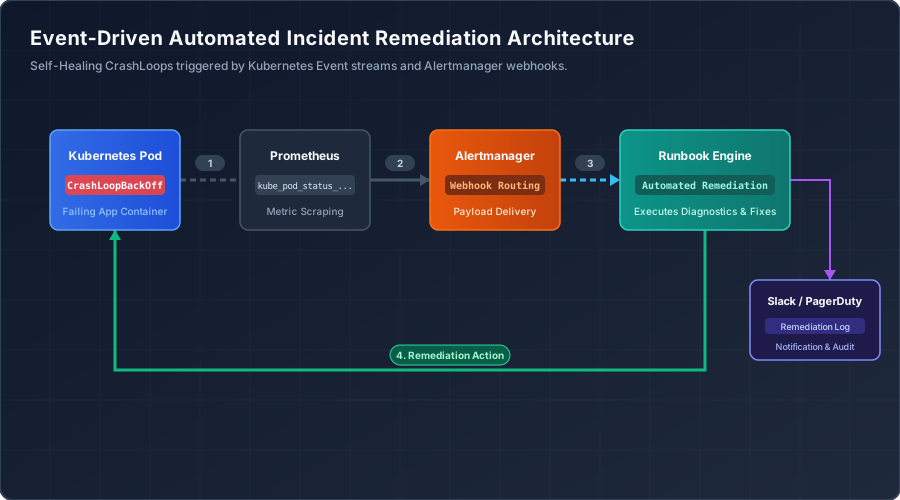
An automated incident remediation pipeline consists of five key components:
- The Detection Layer: Collects state metrics and events from the cluster. We rely on the Kubernetes API Server and Prometheus (scraping
kube-state-metrics) to expose container status. - The Router (Alertmanager): Receives alerts, deduplicates them, groups them by service boundaries, and dispatches them to a webhook receiver based on target labels (e.g.,
action: auto-remediate). - The Runbook Engine: An internal, authenticated HTTP service that parses Alertmanager payloads and matches them with executable runbooks.
- The Execution Layer: A worker pool (running as a Go/Python daemon) that interacts with the Kubernetes API to gather logs, fetch events, run diagnostics, and modify resources.
- The Audit Log: A Slack channel or logging database that captures the exact steps taken by the automation, ensuring human operators have complete visibility into the automated system’s actions.
By using Alertmanager as our routing engine, we leverage its built-in inhibition and silencing rules. This prevents the remediation runner from triggering during scheduled maintenance windows or cluster upgrades.
Detecting CrashLoops Safely with Prometheus and Alertmanager
Detecting a CrashLoopBackOff requires querying the state of the container’s waiting reason. While querying the container restarts count (kube_pod_container_status_restarts_total) is useful, it can lead to false positives during rolling updates when an old container is gracefully terminated.
To build a reliable trigger, we evaluate the container status waiting reason specifically for the string "CrashLoopBackOff" and ensure the pod is not already in a terminating state.
// snippet-1
apiVersion: monitoring.coreos.com/v1
kind: PrometheusRule
metadata:
  name: kubernetes-self-healing-rules
  labels:
    role: alert-rules
spec:
  groups:
  - name: self-healing.rules
    rules:
    - alert: PodCrashLoopBackOffTrigger
      expr: |
        sum by (namespace, pod, container) (
          kube_pod_container_status_waiting_reason{reason="CrashLoopBackOff"}
        ) == 1
      for: 1m
      labels:
        severity: critical
        action: auto-remediate
        remediation_runbook: pod-restart-diagnose
      annotations:
        summary: "Pod  in namespace  is in CrashLoopBackOff"
        description: "Container  has failed repeatedly and is in backoff. Triggering automated webhook runbook."
The key to this rule is the remediation_runbook label. Alertmanager routes alerts with the action: auto-remediate label directly to our webhook receiver, while traditional pagers are silenced until the automated remediation fails or the cooldown window expires.
Building the Runbook Engine: Webhook Receiver
The webhook receiver must be lightweight, secure, and asynchronous. It should authenticate requests using a pre-shared HMAC token, parse the Alertmanager payload, and quickly delegate the execution of the runbook to a background worker to avoid timing out the Alertmanager HTTP request.
Below is a production-grade webhook receiver written in Go:
// snippet-2
package main

import (
	"crypto/subtle"
	"encoding/json"
	"fmt"
	"log"
	"net/http"
	"os"
	"time"
)

type Alert struct {
	Status       string            `json:"status"`
	Labels       map[string]string `json:"labels"`
	Annotations  map[string]string `json:"annotations"`
	StartsAt     time.Time         `json:"startsAt"`
	EndsAt       time.Time         `json:"endsAt"`
	GeneratorURL string            `json:"generatorURL"`
}

type WebhookPayload struct {
	Receiver          string            `json:"receiver"`
	Status            string            `json:"status"`
	Alerts            []Alert           `json:"alerts"`
	GroupLabels       map[string]string `json:"groupLabels"`
	CommonLabels      map[string]string `json:"commonLabels"`
	CommonAnnotations map[string]string `json:"commonAnnotations"`
	ExternalURL       string            `json:"externalURL"`
}

func authMiddleware(next http.HandlerFunc, token string) http.HandlerFunc {
	return func(w http.ResponseWriter, r *http.Request) {
		authToken := r.Header.Get("X-Remediation-Token")
		if authToken == "" || subtle.ConstantTimeCompare([]byte(authToken), []byte(token)) != 1 {
			http.Error(w, "Unauthorized", http.StatusUnauthorized)
			return
		}
		next(w, r)
	}
}

func handleWebhook(w http.ResponseWriter, r *http.Request) {
	if r.Method != http.MethodPost {
		http.Error(w, "Method not allowed", http.StatusMethodNotAllowed)
		return
	}

	var payload WebhookPayload
	if err := json.NewDecoder(r.Body).Decode(&payload); err != nil {
		log.Printf("Failed to decode webhook payload: %v", err)
		http.Error(w, "Bad request", http.StatusBadRequest)
		return
	}

	for _, alert := range payload.Alerts {
		if alert.Status != "firing" {
			continue
		}
		runbook := alert.Labels["remediation_runbook"]
		namespace := alert.Labels["namespace"]
		pod := alert.Labels["pod"]

		if runbook == "" || namespace == "" || pod == "" {
			log.Printf("Skipping alert missing runbook labels: %+v", alert.Labels)
			continue
		}

		log.Printf("Triggering runbook %s for pod %s/%s", runbook, namespace, pod)
		go executeRunbook(runbook, namespace, pod)
	}

	w.WriteHeader(http.StatusAccepted)
	w.Write([]byte(`{"status":"triggered"}`))
}

func executeRunbook(runbook, namespace, pod string) {
	log.Printf("Executing runbook %s on %s/%s at %v", runbook, namespace, pod, time.Now())
	// In production, this invokes the Kubernetes Python API runner or dispatches to a worker queue.
}

func main() {
	token := os.Getenv("REMEDIATION_TOKEN")
	if token == "" {
		log.Fatal("REMEDIATION_TOKEN environment variable is required")
	}

	http.HandleFunc("/webhook", authMiddleware(handleWebhook, token))
	log.Println("Remediation server listening on :8080...")
	log.Fatal(http.ListenAndServe(":8080", nil))
}
The Go webhook handler uses subtle.ConstantTimeCompare to avoid timing attacks when checking tokens, and handles execution in a separate goroutine (go executeRunbook) to immediately release the Alertmanager connection with a 202 Accepted status.
Implementing Safe Runbooks: The Remediation Actions
When a service is crash-looping, blind restarts can worsen the situation. For instance, if the service is crashing because a downstream database is locked, restarting the service will flood the database with new connection attempts, prolonging the database outage.
Therefore, a remediation runbook must first capture diagnostic data (logs and Kubernetes event histories) before executing any corrective action.
// snippet-3
import os
import sys
from kubernetes import client, config
from kubernetes.client.rest import ApiException

def run_remediation(namespace, pod_name):
    try:
        config.load_incluster_config()
    except config.ConfigException:
        config.load_kube_config()

    v1 = client.CoreV1Api()

    print(f"Starting diagnosis for pod {namespace}/{pod_name}")

    try:
        pod = v1.read_namespaced_pod(name=pod_name, namespace=namespace)
        container_name = pod.spec.containers[0].name

        # 1. Fetch Logs from the previous crashed container instance
        print(f"Fetching logs for container {container_name} (previous=True)")
        try:
            logs = v1.read_namespaced_pod_log(
                name=pod_name,
                namespace=namespace,
                container=container_name,
                tail_lines=150,
                previous=True
            )
            print("--- Captured Crash Logs ---")
            print(logs)
            print("---------------------------")
        except ApiException as e:
            print(f"Could not fetch previous logs: {e.reason}. Falling back to active logs.")
            logs = v1.read_namespaced_pod_log(
                name=pod_name,
                namespace=namespace,
                container=container_name,
                tail_lines=100
            )

        # 2. Capture Kubernetes Pod Events
        event_list = v1.list_namespaced_event(namespace=namespace, field_selector=f"involvedObject.name={pod_name}")
        print("--- Captured Pod Events ---")
        for event in event_list.items[-5:]:
            print(f"[{event.last_timestamp}] {event.reason}: {event.message}")
        print("---------------------------")

        # 3. Mitigate: Gracefully delete the pod to force a fresh rescheduling
        print(f"Deleting pod {pod_name} to trigger recovery")
        v1.delete_namespaced_pod(
            name=pod_name,
            namespace=namespace,
            body=client.V1DeleteOptions(grace_period_seconds=10)
        )
        print("Remediation execution completed successfully.")

    except ApiException as e:
        print(f"API Error executing remediation: {e}", file=sys.stderr)
        sys.exit(1)

if __name__ == "__main__":
    ns = os.getenv("POD_NAMESPACE")
    name = os.getenv("POD_NAME")
    if not ns or not name:
        print("Error: POD_NAMESPACE and POD_NAME environment variables must be set.", file=sys.stderr)
        sys.exit(1)
    run_remediation(ns, name)
To run this Python script, the pod housing the runbook engine needs a specific ServiceAccount and a Role with the minimum required access permissions. The role should only allow read access to logs and events, and write access (deletion) limited to pods.
// snippet-4
apiVersion: v1
kind: ServiceAccount
metadata:
  name: remediation-runner
  namespace: infrastructure
---
apiVersion: rbac.authorization.k8s.io/v1
kind: Role
metadata:
  name: pod-remediator
  namespace: production
rules:
- apiGroups: [""]
  resources: ["pods"]
  verbs: ["get", "list", "delete"]
- apiGroups: [""]
  resources: ["pods/log"]
  verbs: ["get"]
- apiGroups: [""]
  resources: ["events"]
  verbs: ["list"]
---
apiVersion: rbac.authorization.k8s.io/v1
kind: RoleBinding
metadata:
  name: remediation-runner-binding
  namespace: production
subjects:
- kind: ServiceAccount
  name: remediation-runner
  namespace: infrastructure
roleRef:
  kind: Role
  name: pod-remediator
  apiGroup: rbac.authorization.k8s.io
Advanced Remediation Patterns: Database Failovers and Stale DNS
A common production incident involves DNS lookup caching. Suppose a PostgreSQL database fails over to a secondary node. The DNS name of the database (e.g., db-primary.production.svc.cluster.local) is updated to point to the new IP address. However, JVM-based applications or Node.js runtimes frequently cache DNS lookups indefinitely or for durations that ignore the DNS TTL.
As a result, when the database connection breaks, the application tries to reconnect to the old, stale IP address, failing continuously and falling into a CrashLoopBackOff.
While deleting the pod resolves this by clearing the runtime’s memory, we can build dynamic DNS resolution directly into our Go database connector. This allows the application to self-heal connection errors before the orchestrator has to kill it.
// snippet-5
package main

import (
	"context"
	"database/sql"
	"fmt"
	"log"
	"net"
	"time"

	_ "github.com/lib/pq"
)

type SafeDBConnector struct {
	dsn        string
	host       string
	port       string
	dbName     string
	user       string
	password   string
	maxRetries int
}

func NewSafeDBConnector(host, port, user, password, dbName string) *SafeDBConnector {
	return &SafeDBConnector{
		host:       host,
		port:       port,
		user:       user,
		password:   password,
		dbName:     dbName,
		maxRetries: 5,
	}
}

func (c *SafeDBConnector) Connect(ctx context.Context) (*sql.DB, error) {
	var db *sql.DB
	var err error
	backoff := 1 * time.Second

	for i := 0; i < c.maxRetries; i++ {
		// Force raw DNS resolution to bypass runtime/OS connection cache
		ips, dnsErr := net.DefaultResolver.LookupIPAddr(ctx, c.host)
		if dnsErr != nil {
			log.Printf("DNS resolution failed for %s: %v", c.host, dnsErr)
		} else if len(ips) > 0 {
			log.Printf("Resolved host %s to IPs: %v", c.host, ips)
			// Construct DSN using the raw IP address to bypass stale caches
			c.dsn = fmt.Sprintf("postgres://%s:%s@%s:%s/%s?sslmode=disable",
				c.user, c.password, ips[0].IP.String(), c.port, c.dbName)
		} else {
			c.dsn = fmt.Sprintf("postgres://%s:%s@%s:%s/%s?sslmode=disable",
				c.user, c.password, c.host, c.port, c.dbName)
		}

		db, err = sql.Open("postgres", c.dsn)
		if err == nil {
			err = db.PingContext(ctx)
			if err == nil {
				log.Println("Database connection established successfully")
				return db, nil
			}
			db.Close()
		}

		log.Printf("Connection attempt %d failed: %v. Retrying in %v...", i+1, err, backoff)

		select {
		case <-time.After(backoff):
			backoff *= 2 // Exponential backoff
		case <-ctx.Done():
			return nil, ctx.Err()
		}
	}

	return nil, fmt.Errorf("failed to connect after %d retries: %w", c.maxRetries, err)
}

func main() {
	ctx, cancel := context.WithTimeout(context.Background(), 30*time.Second)
	defer cancel()

	connector := NewSafeDBConnector("db-primary.production.svc.cluster.local", "5432", "postgres", "secret", "app_db")
	db, err := connector.Connect(ctx)
	if err != nil {
		log.Fatalf("Fatal error connecting to database: %v", err)
	}
	defer db.Close()
}
By resolving the DNS record explicitly on every connection retry sequence, we ensure the application follows changes in active IPs, mitigating connection issues during database cluster failovers without needing orchestrator intervention.
Safe Execution Boundaries and Anti-Patterns
Implementing automated remediation introduces a major risk: the remediation loop. If a service is crash-looping because of a syntax error introduced in a new deployment or database migration, restarting it will not fix the issue. An unrestricted automated runbook will repeatedly delete and recreate the pod, causing a cascade of API events, overloading the container registry, and filling up logging storage.
To prevent this, the runbook engine must implement a circuit breaker pattern. We define strict limits on:
- Concurrency: How many pods in a single namespace can be remediated simultaneously.
- Frequency: The maximum number of remediation attempts allowed for a single pod within a specific timeframe.
- Cooldown: A mandatory waiting window between actions.
// snippet-6
remediation_rules:
  - name: restart-crashlooping-pod
    trigger_alert: PodCrashLoopBackOffTrigger
    cooldown_window: 15m
    max_actions_per_hour: 3
    concurrency_limit: 2
    actions:
      - type: gather_diagnostics
        params:
          log_lines: 100
          upload_destination: s3://infrastructure-diagnostics-prod/crashloops/
      - type: safe_restart
        params:
          grace_period: 15
          verify_readiness: true
    fallback:
      - type: escalate_alert
        params:
          channel: "#incident-critical"
          target: "pagerduty"
          message: "Remediation circuit breaker tripped. Manual intervention required for pod ."
If the engine performs 3 restarts within an hour and the pod continues to crash, the circuit breaker trips. The automated engine stops executing remediation actions and escalates the alert to human operators via Slack and PagerDuty, attaching the gathered diagnostics to the ticket.
Conclusion
Automated incident remediation transitions operational knowledge from static documentation into executable software. By integrating Prometheus alerts, Alertmanager webhooks, and the Kubernetes API, you can resolve transient system failures—such as stale DNS, microservice connection lockups, and transient memory leaks—in seconds rather than minutes.
To deploy this in production, start with a read-only strategy: configure your runbooks to collect diagnostics and post them to Slack without taking destructive actions. Once you verify the accuracy of the diagnostics and the reliability of the trigger rules, implement write actions with strict circuit breakers. This phased approach minimizes risks and establishes trust in your automated systems.